Planning and forecasting
Marketing budget reallocation model at a fixed total spend
Move spend between channels without changing the total. See a marketing budget reallocation model with a worked example and how much a 1% modeled gain deserves.
Brandon Cade · Oct 4, 2026 · 8 min read
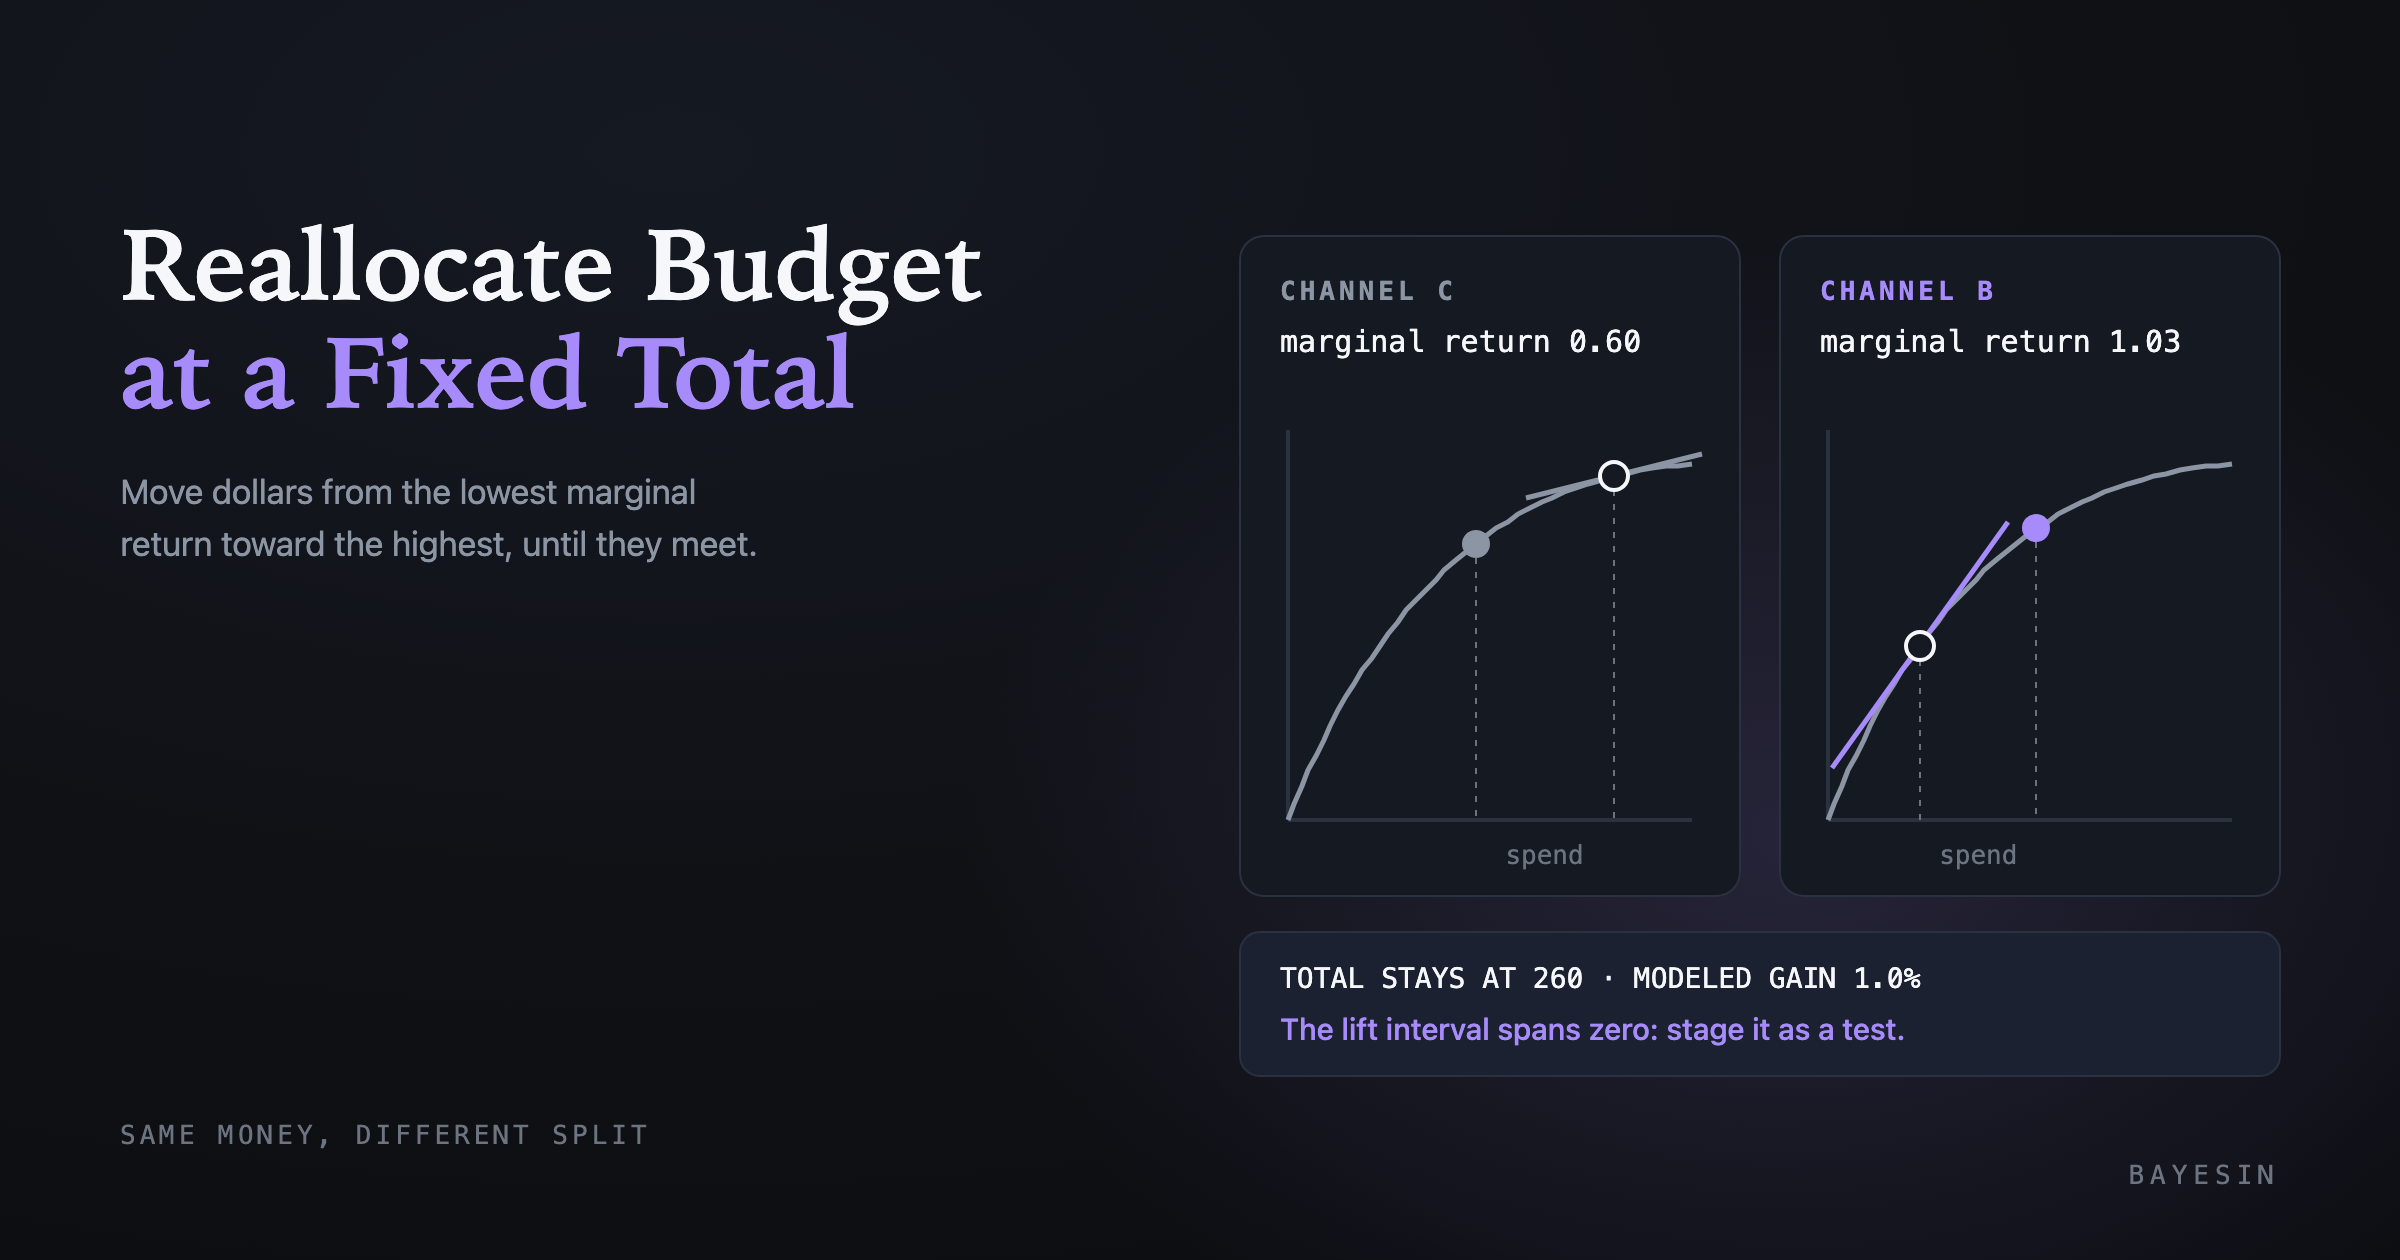
Key Takeaways
- Holding the total fixed isolates one question: does a different split of the same money earn more?
- The rule is to move dollars from the lowest marginal return to the highest, until the marginal returns are close to equal.
- Bound how far any channel can move, because response curves are trustworthy only near the spend you have observed.
- A small modeled gain can sit inside a wide interval. In my synthetic example, a 1.0% gain had a lift interval that spans zero.
- Treat a reallocation as a staged test with a written expectation, not as a commitment.
Many budget conversations concern how to split the money more than how much to spend. A marketing budget reallocation model at a fixed total answers that narrower question. It also avoids arguing about the size of the budget at the same time.
What does reallocating at a fixed total spend mean?
Reallocating at a fixed total spend means changing how money is divided across channels while the sum stays the same. You compare the modeled outcome of the new split with the modeled outcome of the current one. Because the total is constant, any change in modeled revenue comes from the mix and not from spending more.
Several open-source tools offer this framing. As of 2026, Google's Meridian documentation describes a fixed-budget scenario. For a given budget, you identify the allocation across channels that maximizes return on investment. Meta's Robyn documentation describes a "maximum response" scenario that calculates the cross-media budget split maximizing response for a given total.
The PyMC-Marketing documentation frames the same task as maximizing total contribution from all channels. Total spending may not exceed the overall budget, and individual channels can carry minimum or maximum limits.
The fixed-total framing does not tell you whether the total is right. For that question you need a flexible-budget scenario, such as a target marginal return, which Meridian also documents.
What do you need before you move a dollar?
You need four things: a response curve for each channel and the marginal return at current spend. You also need a limit on how far each channel can move. The fourth is an interval on the marginal return, without which you can rank channels but cannot say how firmly the ranking holds.
A response curve maps weekly or monthly spend to modeled revenue, and it bends over as spend rises, a pattern known as diminishing returns. The marginal return is the revenue from the next dollar at today's spend, which is the slope of the curve at that point. Robyn's documentation calls marginal ROAS the most important metric for budget allocation.
A channel with a high marginal return is a candidate to receive money, while one with a low return is a candidate to surrender it. Limits matter because a curve is fitted to the range of spend you have actually tried. Meridian's fixed-budget defaults let each channel move between 70% and 130% of its baseline allocation. Beyond a band of that kind, the curve is merely extrapolating.
Finding a better split with a fixed-total model
Give each next dollar to whichever channel has the highest marginal return at that moment, and stop when the marginal returns are nearly equal. This is a greedy procedure, and with curves that flatten it approaches the optimum. It is also easy to explain, because you can state why every dollar moved.
A three-channel example
There are three channels with monthly spend of $120, $80 and $60 thousand, a $260 thousand total. Their modeled monthly revenue is $280, $120 and $70 thousand. The marginal returns at those points are 0.78, 1.02 and 0.60 dollars of revenue per additional dollar.
I drew a saturating curve for each channel through its current revenue and current marginal return. The form is revenue = ceiling x spend / (spend + half), where "half" is the spend at which a channel reaches half its ceiling. I then ran the greedy rule in 400 equal steps of the $260 thousand total.
- A — Current spend: 120.0; Reallocated spend: 113.8; Change: -5%; Marginal return now: 0.78; Marginal return after: 0.84
- B — Current spend: 80.0; Reallocated spend: 105.3; Change: +32%; Marginal return now: 1.02; Marginal return after: 0.84
- C — Current spend: 60.0; Reallocated spend: 40.9; Change: -32%; Marginal return now: 0.60; Marginal return after: 0.84
Reading the result
After the move, all three marginal returns converge near 0.84. That is the signature of a good split under this model, because no channel offers a better next dollar than another. Modeled revenue rises from $470 thousand to approximately $475 thousand, a gain of 1.0%.
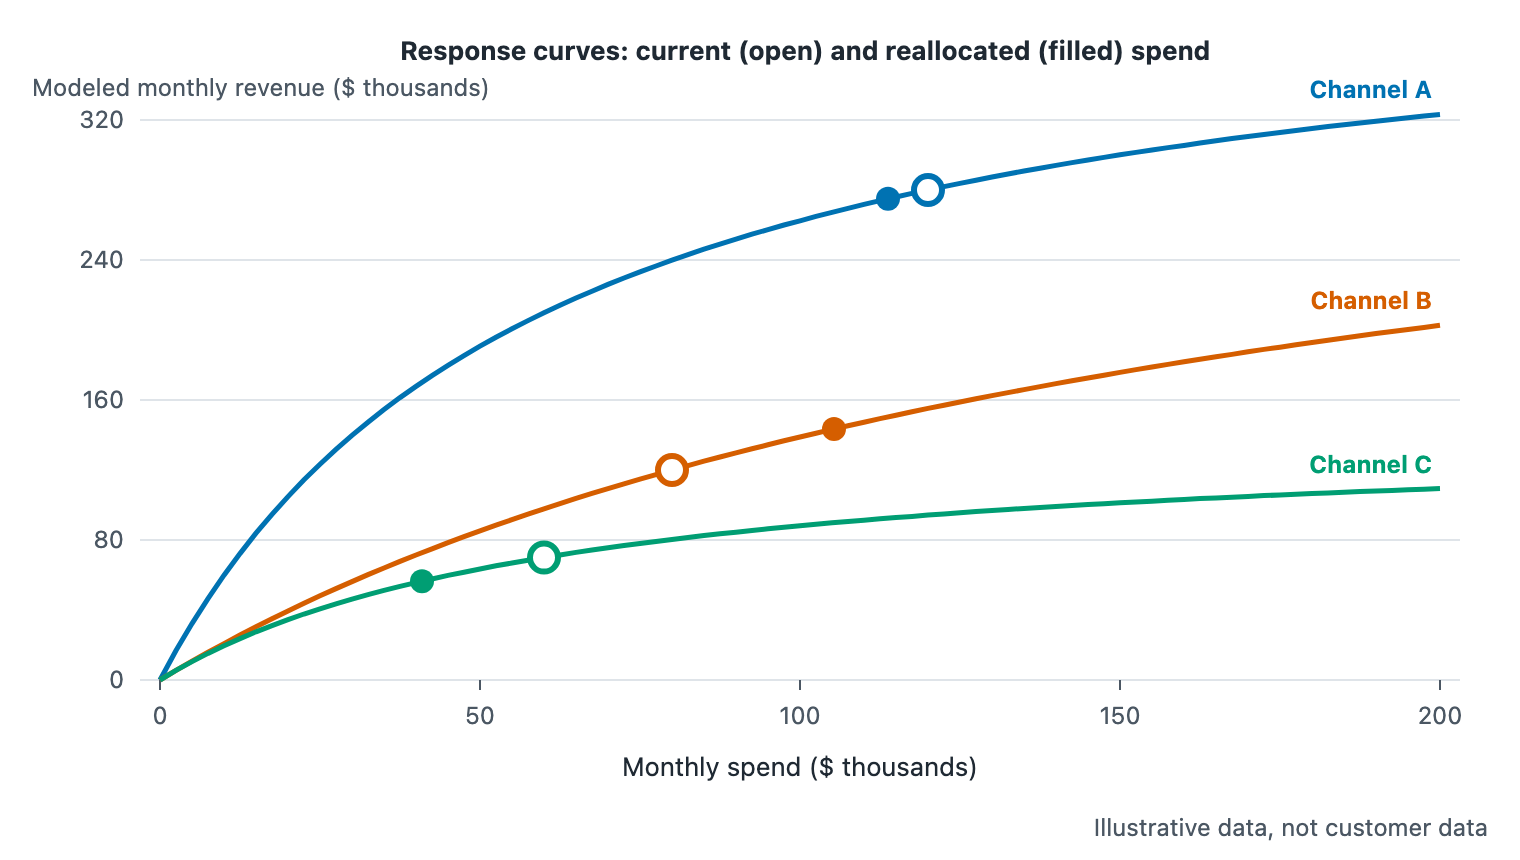
Figure 1. Three response curves. Open circles mark current spend, and filled circles mark the reallocated split.
Consider the magnitude of the gain. Cutting Channel C by 32% and raising Channel B by 32% produces only a 1.0% change in modeled revenue. That is typical when the current marginal returns are not far apart. Whether the move is worth making depends on how sure you are of the marginal returns in the first place.
How sure are you that the move helps?
The move helps at the modeled center, but the uncertainty can swamp a gain this small. In the synthetic example, the reallocation adds approximately $4.8 thousand per month at the median, with an 80% interval from -$6.4 to +$18.2 thousand. It raises revenue in approximately 69% of the modeled draws.
How I drew the uncertainty
I treated each channel's marginal return as uncertain and drew it independently from a lognormal distribution centered on the point value. The spread of 0.35 is an assumption that I chose for illustration. I held each channel's current contribution fixed and rebuilt the curve for each of 20,000 draws. Both the reallocation and the current split were scored on the same draws.
A Bayesian model provides this kind of spread directly from its fitted posterior. Meridian's documentation states that its model generates the joint posterior distribution for every estimated metric, including ROI, marginal ROI and response curves. Its credible intervals therefore reflect uncertainty in all parameters. In my example I imitated that with assumed spreads, so the interval width is a teaching choice and not a finding.
What the intervals show
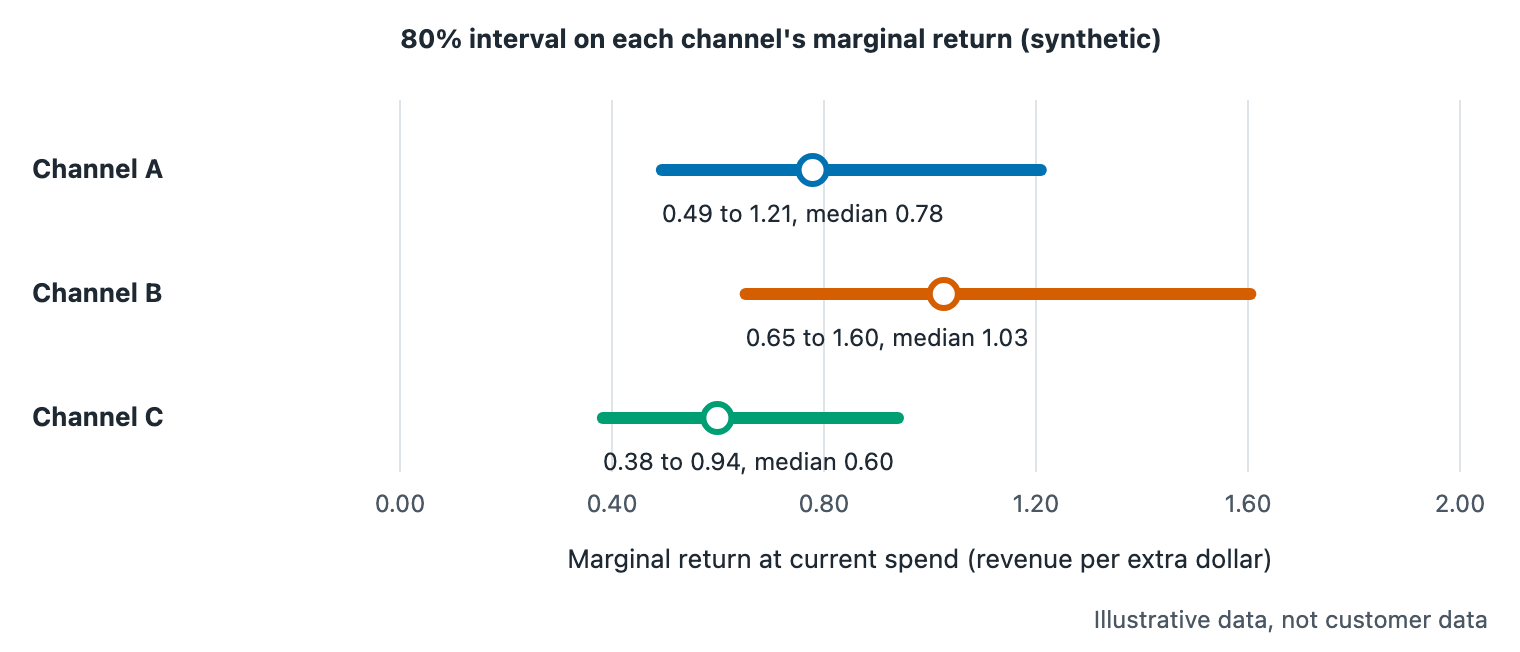
Figure 2. 80% intervals on each channel's marginal return at current spend. Illustrative numbers, not real customer data.
The picture explains the result. Channel A's interval (0.49 to 1.21) and Channel B's (0.65 to 1.60) overlap heavily. The data cannot yet determine which channel has the better next dollar. Channel C's interval sits lower, which is why it is the safest source of money.
A smaller move tells a similar story. Shifting only $20 thousand from A to B gives a median change of +$1.5 thousand. The 80% interval is -$10.1 to +$12.7 thousand, and the gain appears in approximately 57% of draws. That outcome is close to a coin flip with a modest upside.
What a fixed-total model leaves out
A fixed-total reallocation is only as good as its curves, and curves omit things. Cross-channel interaction, carryover from earlier spend and changes in the market are absent from a model with one curve per channel. The model also optimizes revenue, so a channel that drives lower-margin sales can look better than it is.
The forecasting literature makes the general point. Forecasting: Principles and Practice warns that a model which fits the training data well will not necessarily forecast well. A curve that describes last year's spend reflects last year's conditions.
There is a second, plainer limit, which is that the curve says nothing about spend levels you have never tried. Keep moves inside the observed range, and prefer several small moves to one large one. Each small move produces new data that narrows the intervals for the next round.
Turning a reallocation into a staged test
Turn it into a staged test with a written expectation. Move a portion of the recommended shift, state the revenue change you expect and its range, and set a review date. If the result lands inside the range, continue; if it lands outside, you have learned that the curve needs updating.
In the example, a first step might move $10 thousand from C to B. The simulation gives a median gain of +$3.2 thousand with an 80% interval of -$1.5 to +$8.4 thousand. The result is positive in approximately 81% of draws. Document that expectation before the move, and compare it with the outcome afterward. A reallocation checked this way improves your model as well as your budget.
Frequently asked questions
Why hold the total fixed at all?
Holding the total fixed separates two decisions that are often tangled together: how much to spend, and where to spend it. With the sum unchanged, any modeled gain originates in the mix. You can then read the split on its own and handle the size of the budget in a separate step.
Should I always move money to the highest-marginal-return channel?
Only within limits. A channel's marginal return falls as you add spend, so the best channel today may not be the best after a large move. The greedy rule handles this by recalculating after every small step. You should also keep moves inside the range of spend that you have observed.
What if two channels have overlapping marginal-return intervals?
Then the data cannot rank them, and a large move between them is a bet. A small, staged move is reasonable if you want the information it will produce. Otherwise leave that pair alone and look for a clearer source of money, such as a channel with a distinctly lower interval.
Does a 1% modeled gain justify the effort?
It depends on the revenue base. One percent of a large base can be meaningful, but an interval that spans zero means you are not sure of the sign. The move can still be worth making as a test, because the new data will tighten the intervals for the next decision.
Where to go from here
Start with the two channels whose marginal returns are closest. Write down each one's marginal return and interval, propose a small shift, and record the range you expect. That single page is the beginning of a defensible reallocation, and the pillar guide shows the rest.
Bayesin's budget simulator holds the total fixed when you press Optimize, and its sliders stop at three times current spend. Its curves are local saturating shapes drawn through two figures the fit reported, and the page states that no interval is carried through the reallocation.
Sources
- Google (2026), "Budget optimization scenarios", Meridian documentation
- Google (2026), "Bayesian inference", Meridian documentation
- Meta, "Robyn features: budget allocator", Robyn documentation
- PyMC-Marketing project, "Budget Allocation with PyMC-Marketing", documentation
- OTexts (Hyndman and Athanasopoulos, 2021), "Evaluating forecast accuracy"
See it on your own rows.
Bayesin is pre-launch. Join the waitlist and we will reach out as access opens.
Get new posts by email.
New posts only. See privacy for what we keep.