Planning and forecasting
What a forecast interval tells you that one number can't
What does an 80% marketing forecast prediction interval mean? See how wide it should be, what it leaves out, and four questions to ask before you trust it.
Brandon Cade · Oct 4, 2026 · 9 min read
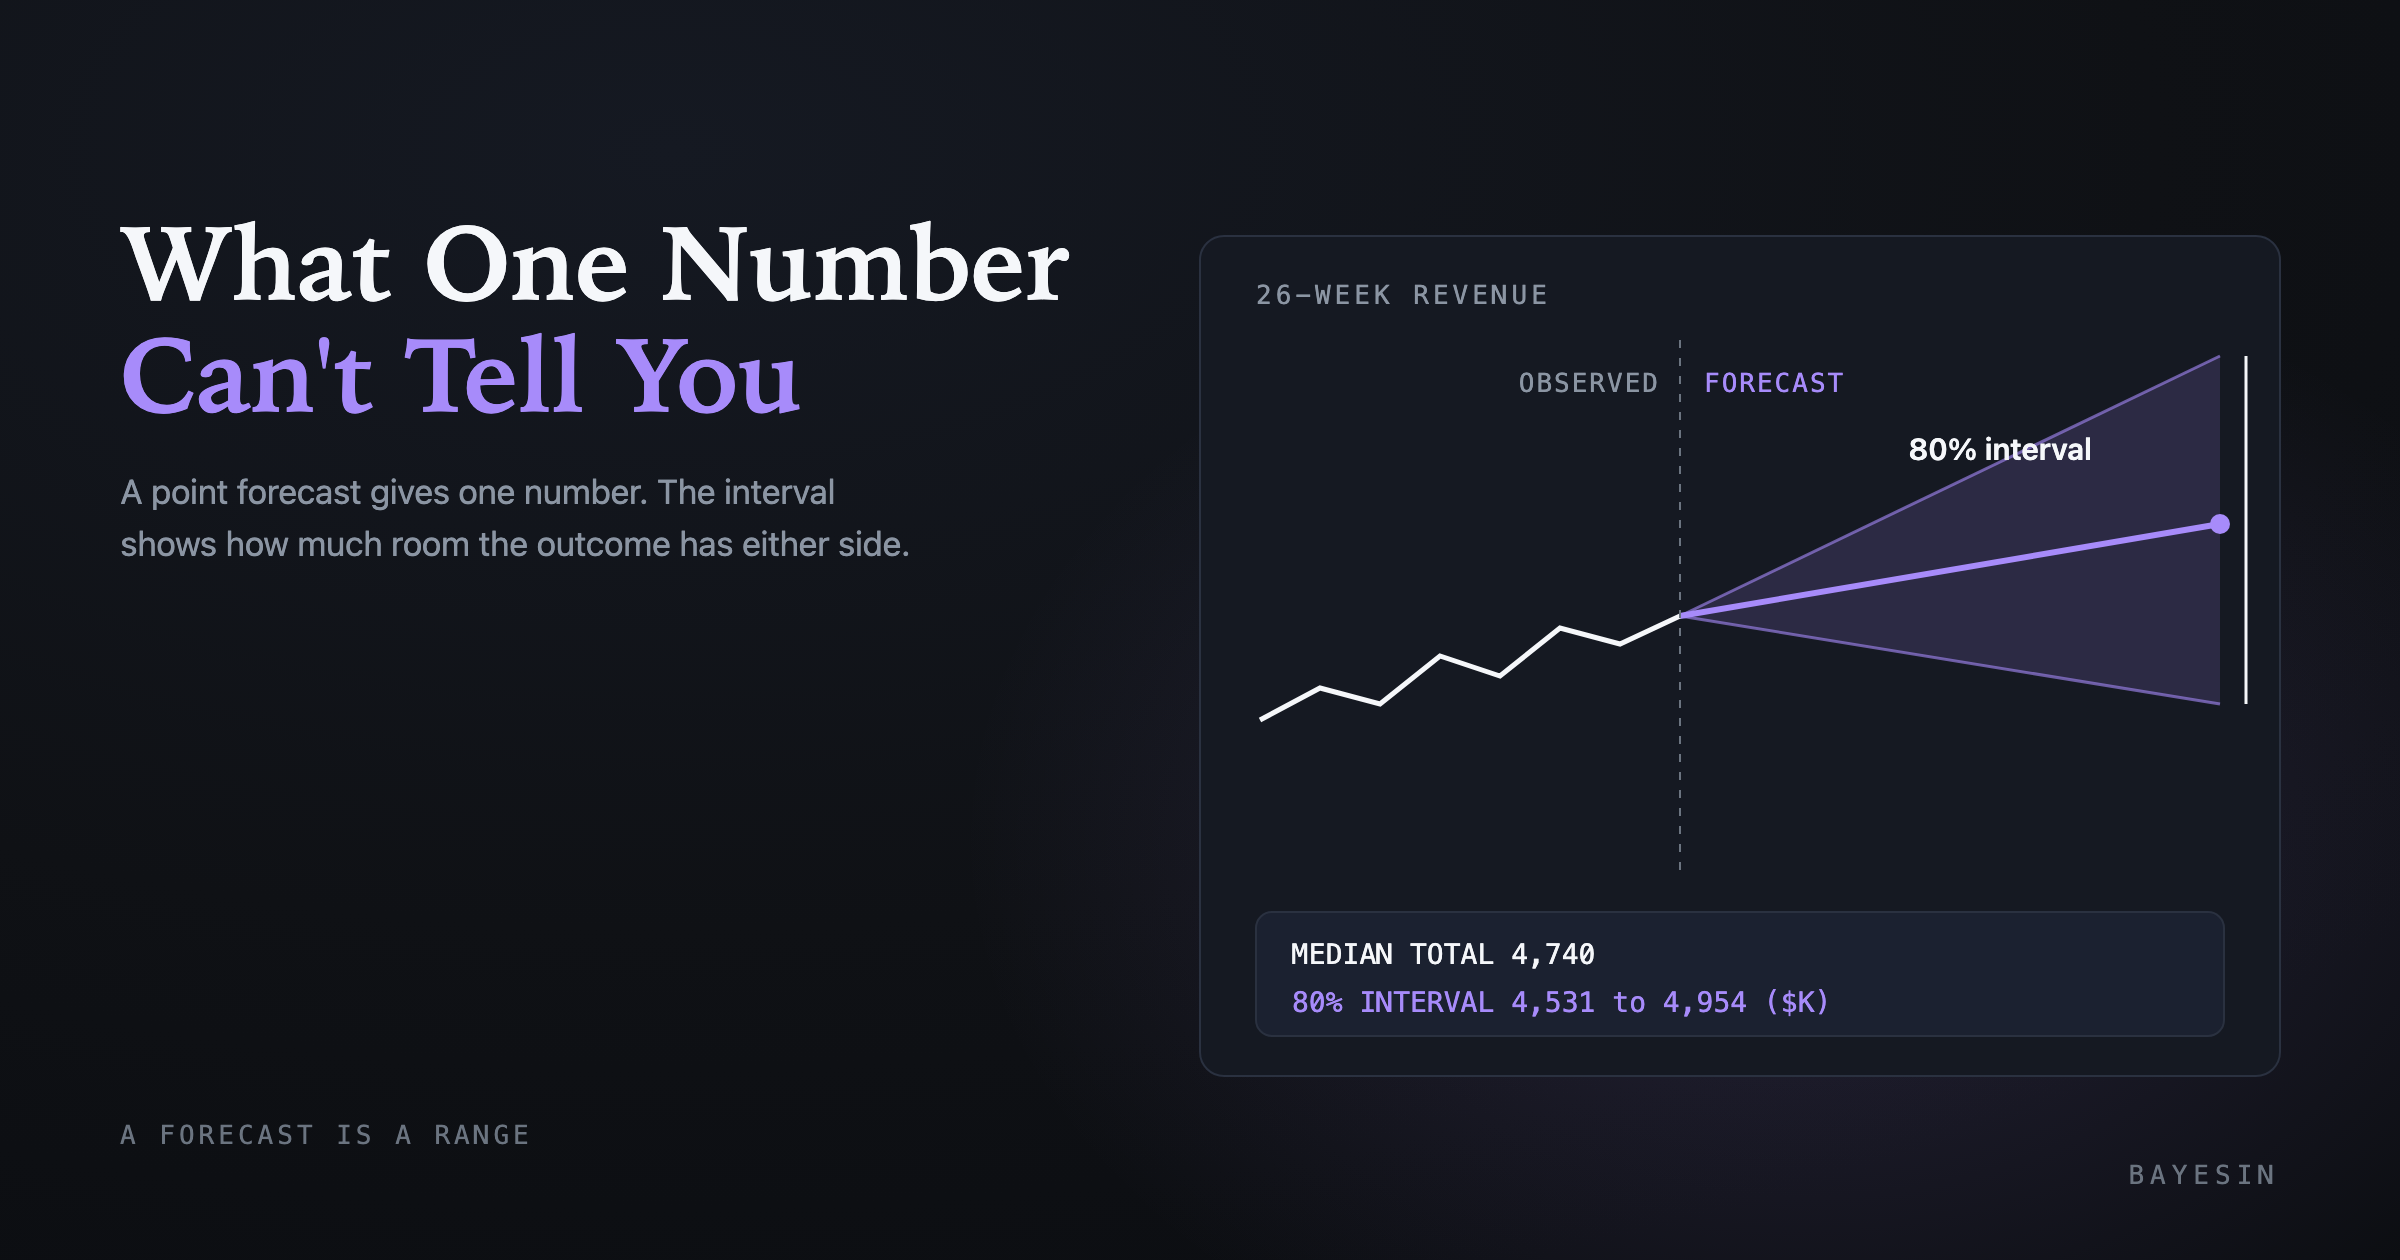
Key Takeaways
- A point forecast gives you one number; an interval shows how much room the outcome has on either side of it.
- An 80% interval means roughly four of every five outcomes should land inside it, and one in five should land outside.
- Published research finds that software intervals usually come out too narrow, so ask how yours was built before you rely on its width.
- A forecast needs enough history to earn an interval. Below a floor, the honest output is a refusal, not a narrower band.
- The total over a horizon has a much tighter interval than the weekly bands added together.
A revenue forecast usually arrives as a single number for next quarter. That number is a useful summary, but it cannot tell you whether a result 3% below it is a surprise or ordinary variation. A marketing forecast prediction interval can, because it states the range within which the outcome should reasonably fall.
This post explains what such an interval represents, where its width originates, and which questions to ask when you receive one. Every worked number is synthetic and labeled as such.
What does a marketing forecast prediction interval tell you?
A forecast interval is a range constructed so that a stated proportion of future outcomes should fall inside it. An 80% interval runs from the 10th to the 90th percentile of the forecast distribution. It answers the question "how far off could this reasonably be?", whereas a point forecast answers only "what is the best single estimate?"
In 2021, Rob Hyndman and George Athanasopoulos wrote in Forecasting: Principles and Practice (OTexts, 3rd edition) that they usually calculate 80% and 95% intervals. Under a normal error assumption, the 80% multiplier is about 1.28 standard deviations and the 95% multiplier is about 1.96.
From here on I call the range an interval, and I always mean the prediction interval defined above. A confidence interval on the fitted line is a different object, because it describes only the uncertainty in the line and is therefore far narrower. Presenting it as if it were the prediction interval makes a forecast appear more precise than the data justifies.
A worked example
The series behind Figure 1 contains 130 weeks of artificial weekly revenue with a gentle upward trend, a yearly cycle and 12% weekly noise. The chart displays the last 52 of those 130 weeks, followed by a 26-week projection.
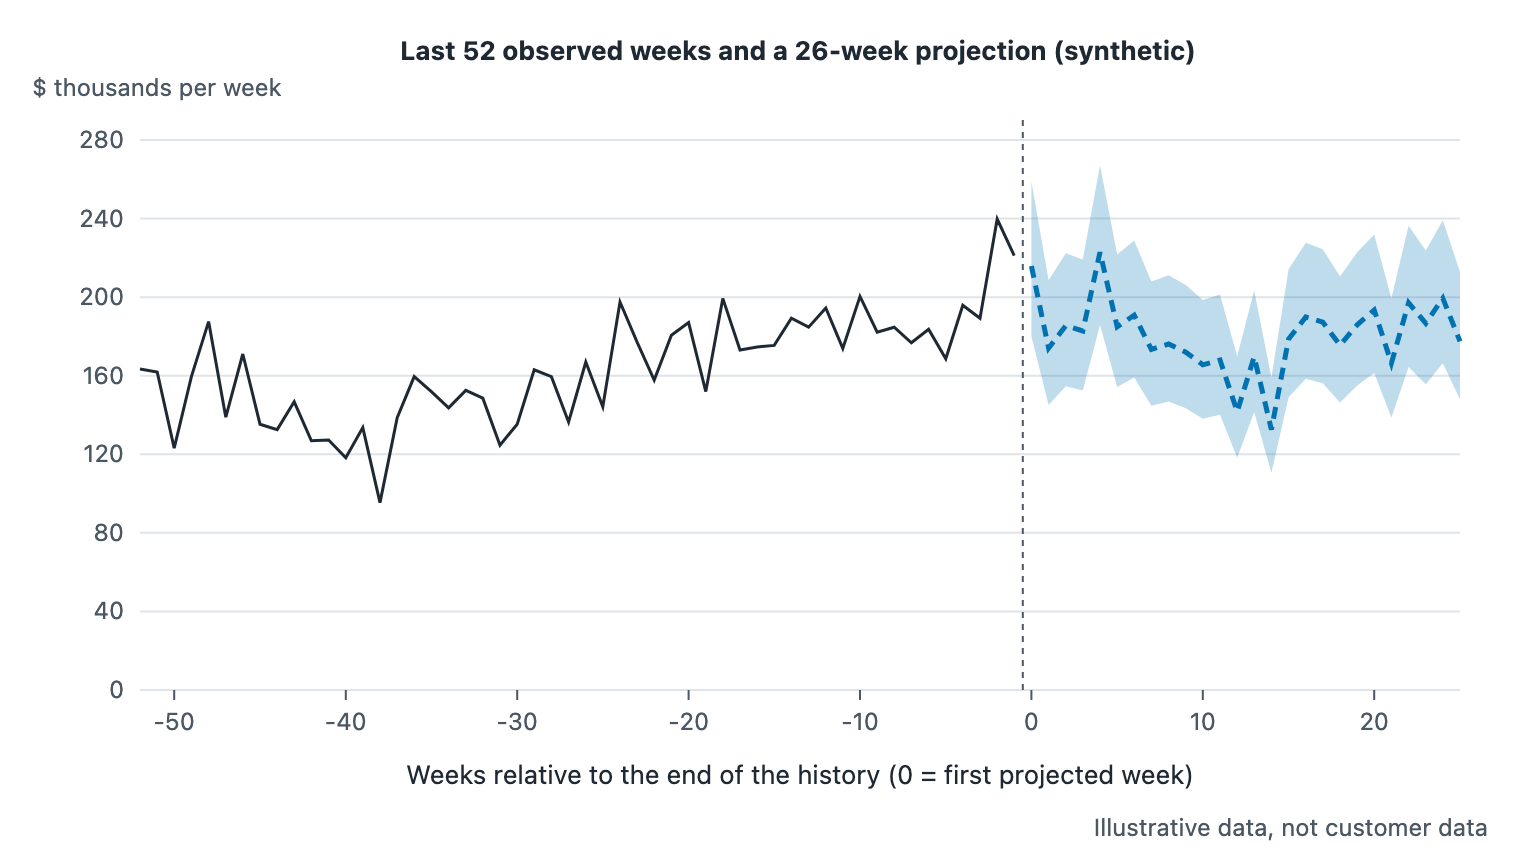
Figure 1. Synthetic weekly revenue in $ thousands, with the projected median (dashed) and the 80% interval for each week. Illustrative numbers, not real customer data.
In this example, week 1 has a median near $216 thousand and an 80% interval of $180 to $259 thousand. Week 26 has a median near $177 thousand and an interval of $148 to $213 thousand. Each weekly interval is wide, at approximately 36% of its median, because individual weeks are inherently noisy.
Why does a single number hide the risk?
A single number conceals the risk because it cannot be wrong in any measurable way. If the forecast says $4.74 million and the quarter lands at $4.60 million, nobody can determine whether that was a miss or ordinary variation. An interval converts the outcome into a test that you can actually run.
Consider what each reader does with the bare number. A finance partner may treat it as a commitment. A marketer may treat it as the midpoint of an implicit range carried in their head. Those two ranges rarely match, and writing the interval down exposes the disagreement before the quarter starts instead of after it ends.
Central banks have published such ranges for decades. In 1998, Britton, Fisher and Whitley explained how the Bank of England constructed the bands in its Inflation Report fan chart. Their article, in the Bank of England Quarterly Bulletin, states that the range of uncertainty was based on forecast errors from the previous ten years.
Does showing uncertainty damage your credibility? The evidence I found suggests that the cost is smaller than most people fear. In 2020, van der Bles and colleagues ran five experiments with 5,780 participants. Their PNAS paper found that people perceived more uncertainty when it was communicated. Trust in the number and its source fell only slightly, mostly when uncertainty was expressed in words rather than as a numeric range.
Those were public-facing statistics, not budget meetings, so treat the result as a reasonable prior rather than a guarantee.
How wide should the interval be?
The interval should be as wide as the data supports, and its width should be derived from the spread of the model's own residuals. A residual is the weekly gap between what the model fitted and what actually happened. A width chosen by hand, or copied from a rule of thumb, claims a confidence that the data never provided.
That principle is easy to state and difficult to achieve. In 2022, Petropoulos and dozens of co-authors surveyed the field in "Forecasting: theory and practice" (arXiv 2012.03854). They note that prediction intervals in software generally underestimate uncertainty, often dramatically, and that practitioners largely leave intervals unused when they are provided.
The same review cites Paul Goodwin's observation that decision makers tend to spurn an interval that looks too wide to be informative. There are therefore two failure modes. An interval that is too narrow misleads you, while one that is too wide gets ignored. The remedy for both is to understand how the width was produced.
Judgment-based ranges show the same pattern. Paul Schoemaker's 1995 article in MIT Sloan Management Review argues that the typical manager is overconfident and gives ranges that are likely much too narrow. His study asked 68 evening MBA students at the University of Chicago for 90% and 50% ranges on issues from their jobs.
Why is the total tighter than the weekly bands?
The total over a horizon has a much tighter interval than the weekly bands added together. Table 1 shows the comparison for the synthetic series above.
- Week 1 — Median: 216; 80% interval: 180 to 259; Width: 79
- Week 26 — Median: 177; 80% interval: 148 to 213; Width: 65
- 26 weekly bands added together — Median: n/a; 80% interval: 3,915 to 5,627; Width: 1,712
- 26-week total — Median: 4,740; 80% interval: 4,531 to 4,954; Width: 423
Table 1. Weekly bands versus the horizon total, in $ thousands. Illustrative numbers from a synthetic simulation, not real customer data.
Adding the weekly lows and highs produces an interval approximately four times wider than the interval on the total. The reason is that week-to-week noise partially cancels across the horizon, since a high week offsets a low one. The error in the fitted level and slope does not cancel, because it influences every week in the same direction.
Stacking the weekly bands assumes that every week lands at its own worst case simultaneously, which is not a scenario worth planning for. I computed the total interval by simulating 20,000 futures from the fitted model, drawing both coefficient error and weekly noise.
How much history does an interval need?
An interval needs enough weeks that the fit has some variation left over to measure. Half a year of weekly data is my minimum for any projection, and a yearly seasonal shape requires two full years. A yearly cycle in weekly data has 52 positions, and the regression estimates 51 seasonal terms because one position is absorbed into the intercept.
Each position needs at least two observations to be distinguished from noise. This follows a warning in Forecasting: Principles and Practice. A perfect fit can always be obtained with enough parameters, and the size of the residuals is not a reliable indication of true forecast error. With one year of weekly data and 51 seasonal terms, the fit would describe the past exactly. It would leave no residual from which to build an interval.
The rules I work with are therefore simple. Below 26 weekly rows, I do not project at all. Between 26 and 103 weeks, I project the trend only and say so explicitly. From 104 weeks, I add the yearly shape. I also cap the horizon at 26 weeks or half the history, whichever is smaller. Extrapolating as far ahead as you have data rests everything on one estimated slope.
A refusal is a legitimate output. A forecast that always produces an answer, whatever the data, is no more useful than one that says "not yet". It is simply harder to catch when it is wrong.
What does an interval still not tell you?
An interval describes the noise around an assumption, and it says nothing about the assumption itself. A trend-and-season forecast assumes that the next six months will resemble the last two years. If you change budgets, run a promotion or face a new competitor, the interval is silent about the consequences.
That distinction matters for how you interpret the far end of the horizon. Under a seasonal fit, the model's own band can stay level across the horizon. Real-world error can still grow, because the world drifts in ways the model does not include. I show this with a simulation in near-term versus far-term forecast error.
An interval also does not compare itself to your plan. Once you have a forecast total and its interval, the next step is to place the plan against it.
What should you ask for on Monday?
Ask for four things whenever a forecast lands in front of you. First, the interval mass, such as 80% or 95%. Second, the method by which the width was derived. Third, the number of weeks of history behind it. Fourth, the factors the model leaves out. A forecast that can answer all four questions is ready to be argued with.
You can also perform a check yourself. Hold back the last several weeks, forecast them from the earlier data, and count how many actual values land inside the 80% interval. If substantially fewer than four in five do, the interval is too narrow for the way your revenue behaves. The chapter on time series cross-validation in Forecasting: Principles and Practice describes the standard setup.
Frequently asked questions
What is the difference between a forecast interval and a confidence interval?
A forecast (prediction) interval covers where a future observation may land, including the noise in that one period. A confidence interval on a fitted line covers only the uncertainty in the line itself, so it is far narrower. For planning, you almost always want the prediction interval.
Why 80% and not 95%?
Either is legitimate, and Hyndman and Athanasopoulos say they usually compute both. An 80% interval is narrower and easier to act on, and you can check it sooner, because one in five outcomes should fall outside it. Choose one, state it, and use it consistently.
Can an interval be wrong?
Yes. An interval is only as good as its assumptions. If the world changes in ways the model omits, real outcomes will land outside the band more often than the stated share. A backtest on held-back weeks is how you find that out.
What if I only have a few months of data?
Then a trend forecast has too little to work with, and I would not publish one. With fewer than 26 weekly rows, the slope mostly reflects recent weeks, and the residual variance has too few degrees of freedom to mean much. Collect more weeks, or state the plan as an explicit assumption instead.
Sources
Every statistic above comes from one of the sources below, all retrieved 2026-09-18. The worked example is synthetic and comes from my own simulation, not from any source.
- OTexts (Hyndman and Athanasopoulos, 2021), "Forecasting: Principles and Practice, 3rd edition: Prediction intervals"
- OTexts (Hyndman and Athanasopoulos, 2021), "Evaluating forecast accuracy"
- OTexts (Hyndman and Athanasopoulos, 2021), "Time series cross-validation"
- arXiv (Petropoulos et al., 2022), "Forecasting: theory and practice"
- MIT Sloan Management Review (Schoemaker, 1995), "Scenario Planning: A Tool for Strategic Thinking" (full text PDF)
- Proceedings of the National Academy of Sciences (van der Bles et al., 2020), "The effects of communicating uncertainty on public trust in facts and numbers"
- Bank of England Quarterly Bulletin (Britton, Fisher and Whitley, 1998), "The Inflation Report projections: understanding the fan chart"
See it on your own rows.
Bayesin is pre-launch. Join the waitlist and we will reach out as access opens.
Get new posts by email.
New posts only. See privacy for what we keep.