Planning and forecasting
Marketing forecast error by horizon: show near and far
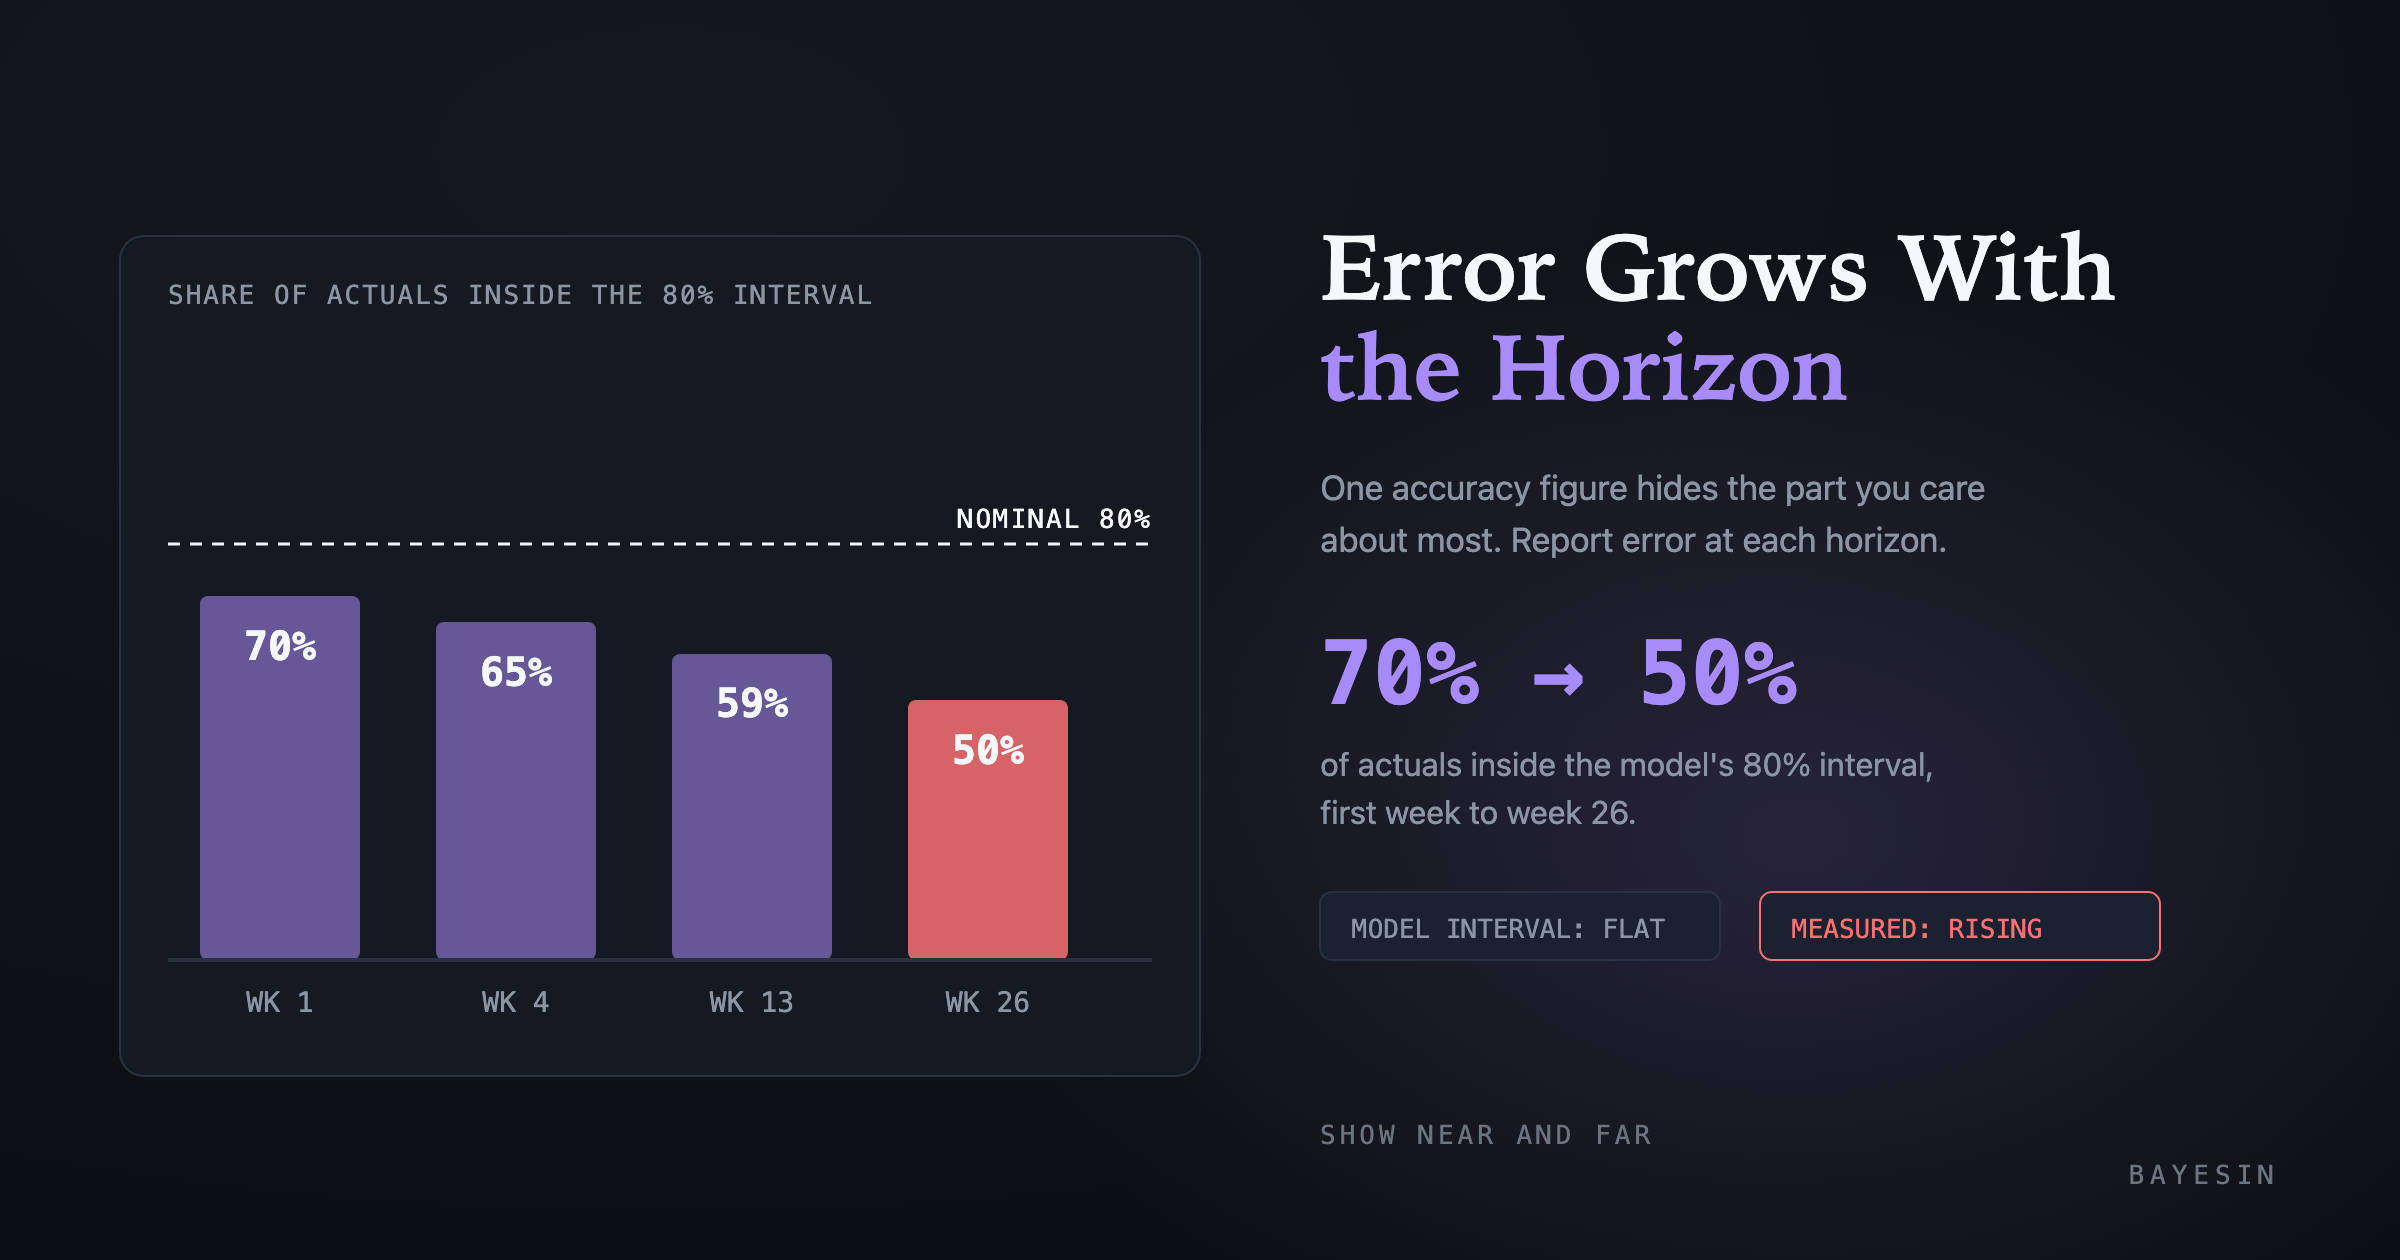
Marketing forecast error grows with the horizon, but a model's own 80% interval may stay flat. Measure error by week with a rolling backtest and report both.
Brandon Cade · Oct 5, 2026 · 8 min read
Key Takeaways
- Forecast error usually grows with the horizon, so a single accuracy figure for "the forecast" hides the part you care about most.
- A model's own interval can stay level across the horizon while measured error rises, because the interval only sees noise around the model's assumptions.
- Measure error at each horizon with a rolling-origin backtest, then report the model interval and the measured error side by side.
- Show at least three horizons, the first week, the middle and the last, together with the horizon total.
- Cap the horizon at what your history can support, and state what that cap is.
A forecast for next week and a forecast for six months out are different products. They share a model and a chart, yet their errors are not the same. This guide shows how to measure marketing forecast error by horizon, how to report it, and how to avoid overstating the far end.
Why does forecast error change with the horizon?
Error changes with the horizon because a longer horizon gives the things a model does not know about more time to happen. The slope may drift, a season may shift, or a channel may change its behavior. Standard forecasting texts expect intervals to lengthen with the horizon, and measured errors usually lengthen as well.
In 2021, Hyndman and Athanasopoulos wrote in Forecasting: Principles and Practice (OTexts, 3rd edition) that prediction intervals usually lengthen as the forecast horizon increases. Their chapter on time series cross-validation shows the same pattern in measured error. For 1- to 8-step-ahead forecasts of a Google stock series, root mean squared error rose steadily with the horizon.
For a marketing team, the practical consequence is straightforward. A near-term forecast is well suited to pacing decisions this month, whereas a far-term forecast is suited to strategic direction. It deserves a wider band and a plainer caveat.
How do you measure marketing forecast error by horizon?
You measure it by forecasting from many past dates and comparing every projected week with what actually happened. This procedure is called a rolling-origin backtest, or time series cross-validation. Group the errors by how many weeks ahead each forecast was made, then summarize each group separately.
The five backtest steps
- Choose your first forecast origin, the date from which you forecast. It needs enough history to fit the model, which for a yearly seasonal shape means 104 weekly rows.
- Fit the model using only data recorded before the origin.
- Project the full horizon, for example 26 weeks, and store each week's median and 80% interval.
- Move the origin forward by a few weeks and repeat until you run out of held-back weeks.
- For each horizon from 1 to 26, compute the absolute percentage error and record whether the actual value landed inside the interval.
Forecasting: Principles and Practice describes this procedure, in which each training set contains only observations that occurred before the test observation. In its chapter on evaluating forecast accuracy, it adds that the test set should ideally be at least as large as the maximum forecast horizon required. Do not tune your model on the same weeks that you use to evaluate it.
What a backtest cannot tell you
A backtest checks whether the revenue path was predicted well. It does not check whether a model's channel contributions are causally correct. As of 2026, Google's Meridian documentation states that the goal in marketing mix modeling is causal inference, and not necessarily to minimize out-of-sample prediction metrics. Treat a backtest as one check among several.
What a synthetic backtest showed
In my synthetic test, the model's interval stayed level across the horizon while measured error rose and coverage fell. The upper edge of the interval sat about 24% above the median at every horizon. Median absolute error climbed from about 14% at week 1 to about 19% at week 26. Only 50% of week-26 actuals landed inside the 80% band.
How I built the test
I generated 20 synthetic weekly series of 220 weeks. Each has a yearly cycle, 12% weekly noise and a growth rate that drifts as a random walk. The drift is the point of the exercise, because real channels, offers and competitors do change. For each series I forecast 26 weeks ahead from 23 origins, starting at week 104 and advancing four weeks each time. That produced 460 forecasts per horizon.
The model was a log-linear trend plus seasonal terms with an 80% interval. A yearly cycle in weekly data has 52 positions, and one of them is absorbed into the intercept, so the model estimates 51 seasonal terms.
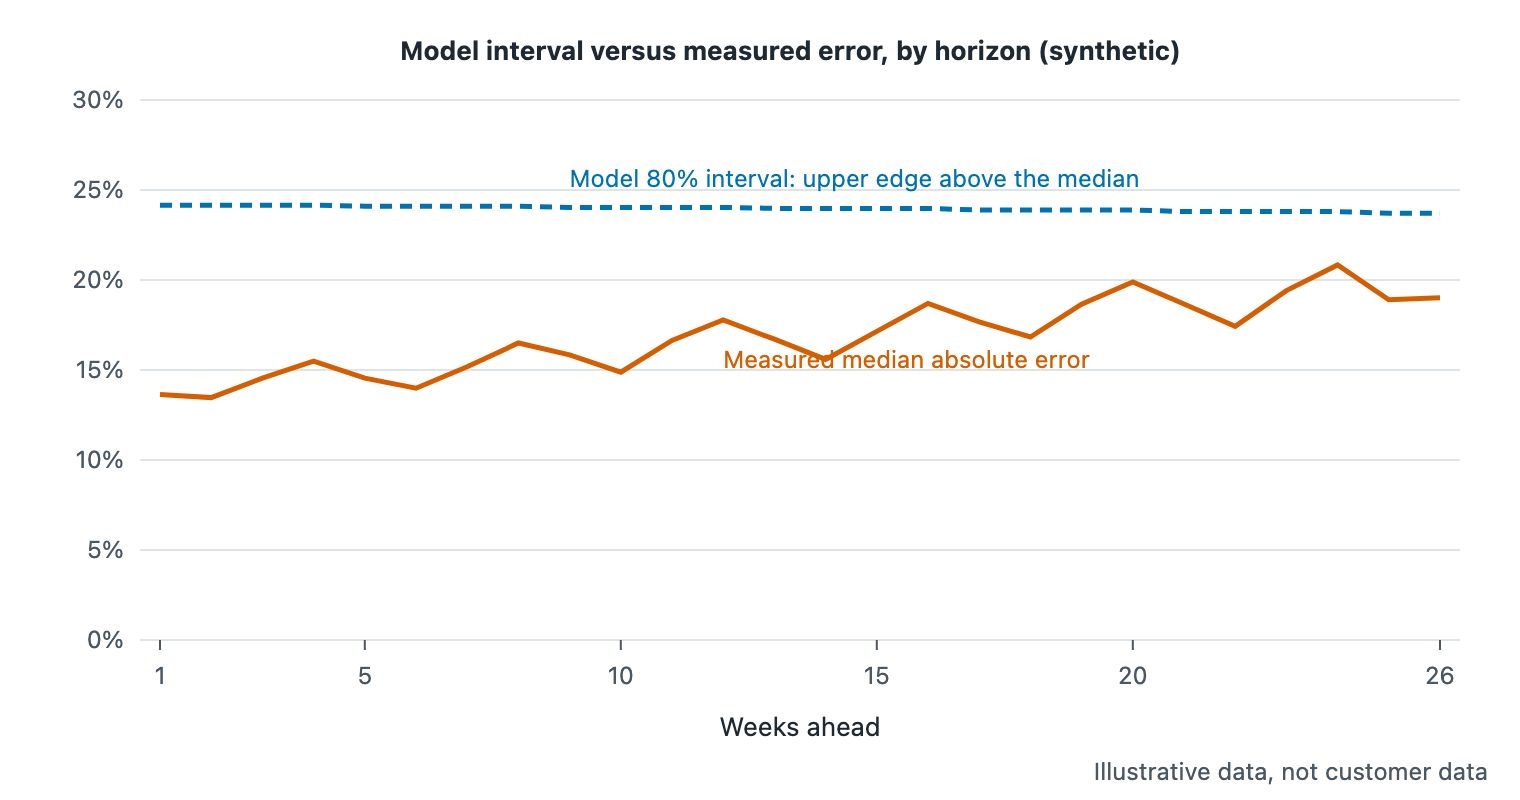
Figure 1. Model interval width versus measured error by horizon, synthetic data with a drifting trend.
Why the band stays level
The level band is a property of the regression. I checked it in the simulation and in the derivation behind Bayesin's forecast code, not in a published source. In a regression with a trend and full seasonal terms, each projected week is predicted from the observations at its own cycle position. When every horizon week sits the same distance beyond those observations, the band width does not need to grow with the horizon.
The unit tests in that code show the band is exactly flat at some sample sizes, such as 130 weeks. They also show it never widens under a seasonal fit. In my simulation the origins vary, so the band narrows slightly, from 24.2% to 23.7%. That is a fair statement of the model's assumptions, and also its blind spot. The band measures noise around a fixed trend and season, and it cannot see the trend moving.
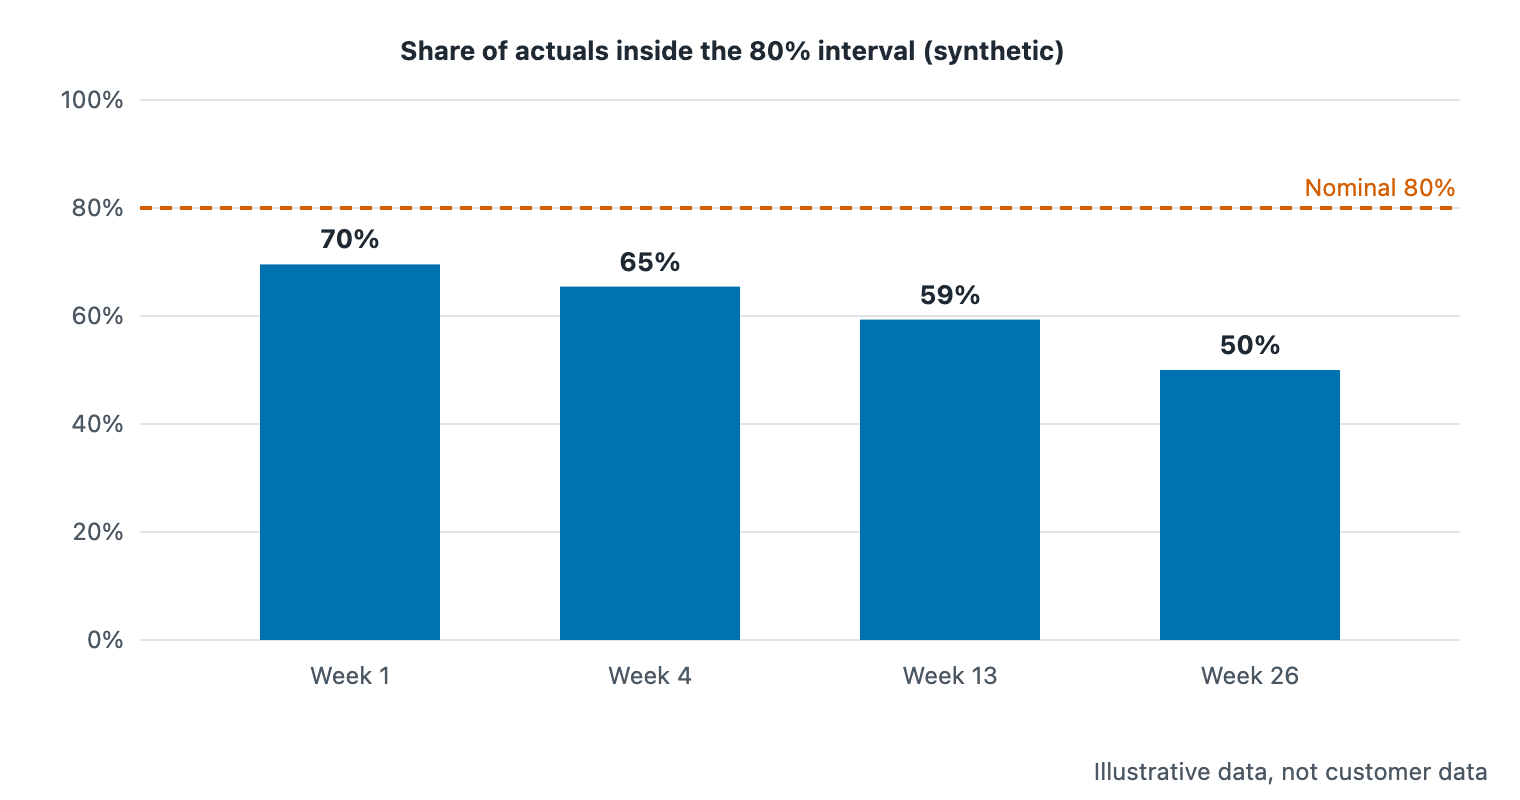
Figure 2. Share of actuals inside the model's 80% interval, by horizon. Same synthetic drifting-trend test.
Even at week 1, coverage fell short of 80%, at 70%, because the drifting growth rate inflates the errors. By week 26 it was 50%. If you had checked only week 1, you would still have seen a shortfall, but not how quickly it compounds.
Reporting near-term and far-term intervals together
Report the model's interval and the measured error side by side, for at least three horizons and for the total. A reader then sees both what the model claims and what history says about that claim. Where the two disagree, you have found the part of the forecast that deserves the most caution.
Table 1 gives the summary from the synthetic test. The "model band" is the model's 80% interval relative to its median. The "measured range" is the 10th to 90th percentile of the actual error across the 460 forecasts at that horizon.
- 1 — Model band: -19.3% to +24.2%; Measured range: -27.3% to +23.3%; Share inside band: 70%
- 4 — Model band: -19.3% to +24.2%; Measured range: -27.7% to +29.6%; Share inside band: 65%
- 13 — Model band: -19.2% to +24.0%; Measured range: -31.4% to +32.1%; Share inside band: 59%
- 26 — Model band: -19.1% to +23.7%; Measured range: -34.4% to +47.4%; Share inside band: 50%
The measured range is the more decision-relevant number, because it reflects how the world behaved and not only what the model assumed. In 2022, Petropoulos and co-authors observed in "Forecasting: theory and practice" that intervals in software generally underestimate uncertainty. With a backtest in hand, widen the far end of the band to the measured range and label it empirically calibrated. Without one, keep the model band and state plainly that it covers noise, not drift.
How far ahead should you forecast?
Forecast only as far as your history can support, and state what the limit is. My rule is the smaller of 26 weeks and half the observed history. A model fitted on 40 weeks gets a 20-week horizon, and a model fitted on a year or more gets 26 weeks. Beyond that, one estimated slope carries too much weight.
The rule has a second use. It stops a distant number from occupying a slide with the same visual weight as next week's. If a stakeholder asks for a 52-week view, provide the 26-week forecast and describe the remainder as a scenario, not a forecast.
Two additional habits help. First, always show the horizon total, since budgets are established against totals. Second, label the last week as the least certain, so that the far end is not interpreted as a promise.
What to do with a wide far-term band
Use the wide far-term band to decide what to commit and what to keep flexible. Commit spend for the weeks where the interval is tight, and hold back a reserve for the weeks where it is not. A far-term band that looks uncomfortably wide is doing its job.
For the plan itself, compare it with the interval and not with a single line. I walk through that in reading the gap to plan, with its uncertainty. When you convert far-term uncertainty into a budget scenario, building a marketing budget scenario you can defend shows how to record the assumptions behind it.
Frequently asked questions
Does error always grow with the horizon?
Usually, but not always in the model's own band. Textbooks expect intervals to lengthen with the horizon, and measured error typically does. Under a trend-and-seasonal regression, the model band can stay level, so the measured error is the real check. That is why I report both together.
How many origins do I need for a backtest?
There is no fixed number. You need sufficient origins that each horizon has a stable error summary. My simulation used 23 origins per series across 20 series. On your own single series, fewer origins mean a noisier summary, so present the result as a rough guide and not as a precise estimate.
What if my backtest coverage is below the stated interval?
Then the model band is too narrow for how your revenue behaves. Widen it to the measured error range at each horizon, and label the result as empirically calibrated. Also tell readers what the model leaves out, since a narrow band often signals change the model cannot see.
Should I report a 95% interval instead?
You can, but the horizon issue is the same. A 95% band is wider and will cover more of the drift, though it is also harder to act on. Whichever mass you choose, use it consistently and check its coverage by horizon.
Where to go from here
Run the five backtest steps on your own weekly revenue, then put the measured range next to the model band in your next planning deck. The guide, Marketing budget planning with uncertainty, in five steps, shows the full sequence.
Sources
- OTexts (Hyndman and Athanasopoulos, 2021), "Prediction intervals"
- OTexts (Hyndman and Athanasopoulos, 2021), "Time series cross-validation"
- OTexts (Hyndman and Athanasopoulos, 2021), "Evaluating forecast accuracy"
- arXiv (Petropoulos et al., 2022), "Forecasting: theory and practice"
- Google (2026), "Assess the model fit and the results", Meridian documentation
See it on your own rows.
Bayesin is pre-launch. Join the waitlist and we will reach out as access opens.
Get new posts by email.
New posts only. See privacy for what we keep.