Planning and forecasting
Marketing budget planning with uncertainty, in five steps
A five-step method for marketing budget planning with uncertainty: an 80% interval on the forecast and the gap to plan, then scenarios and a 13-week schedule.
Brandon Cade · Oct 8, 2026 · 14 min read
Key Takeaways
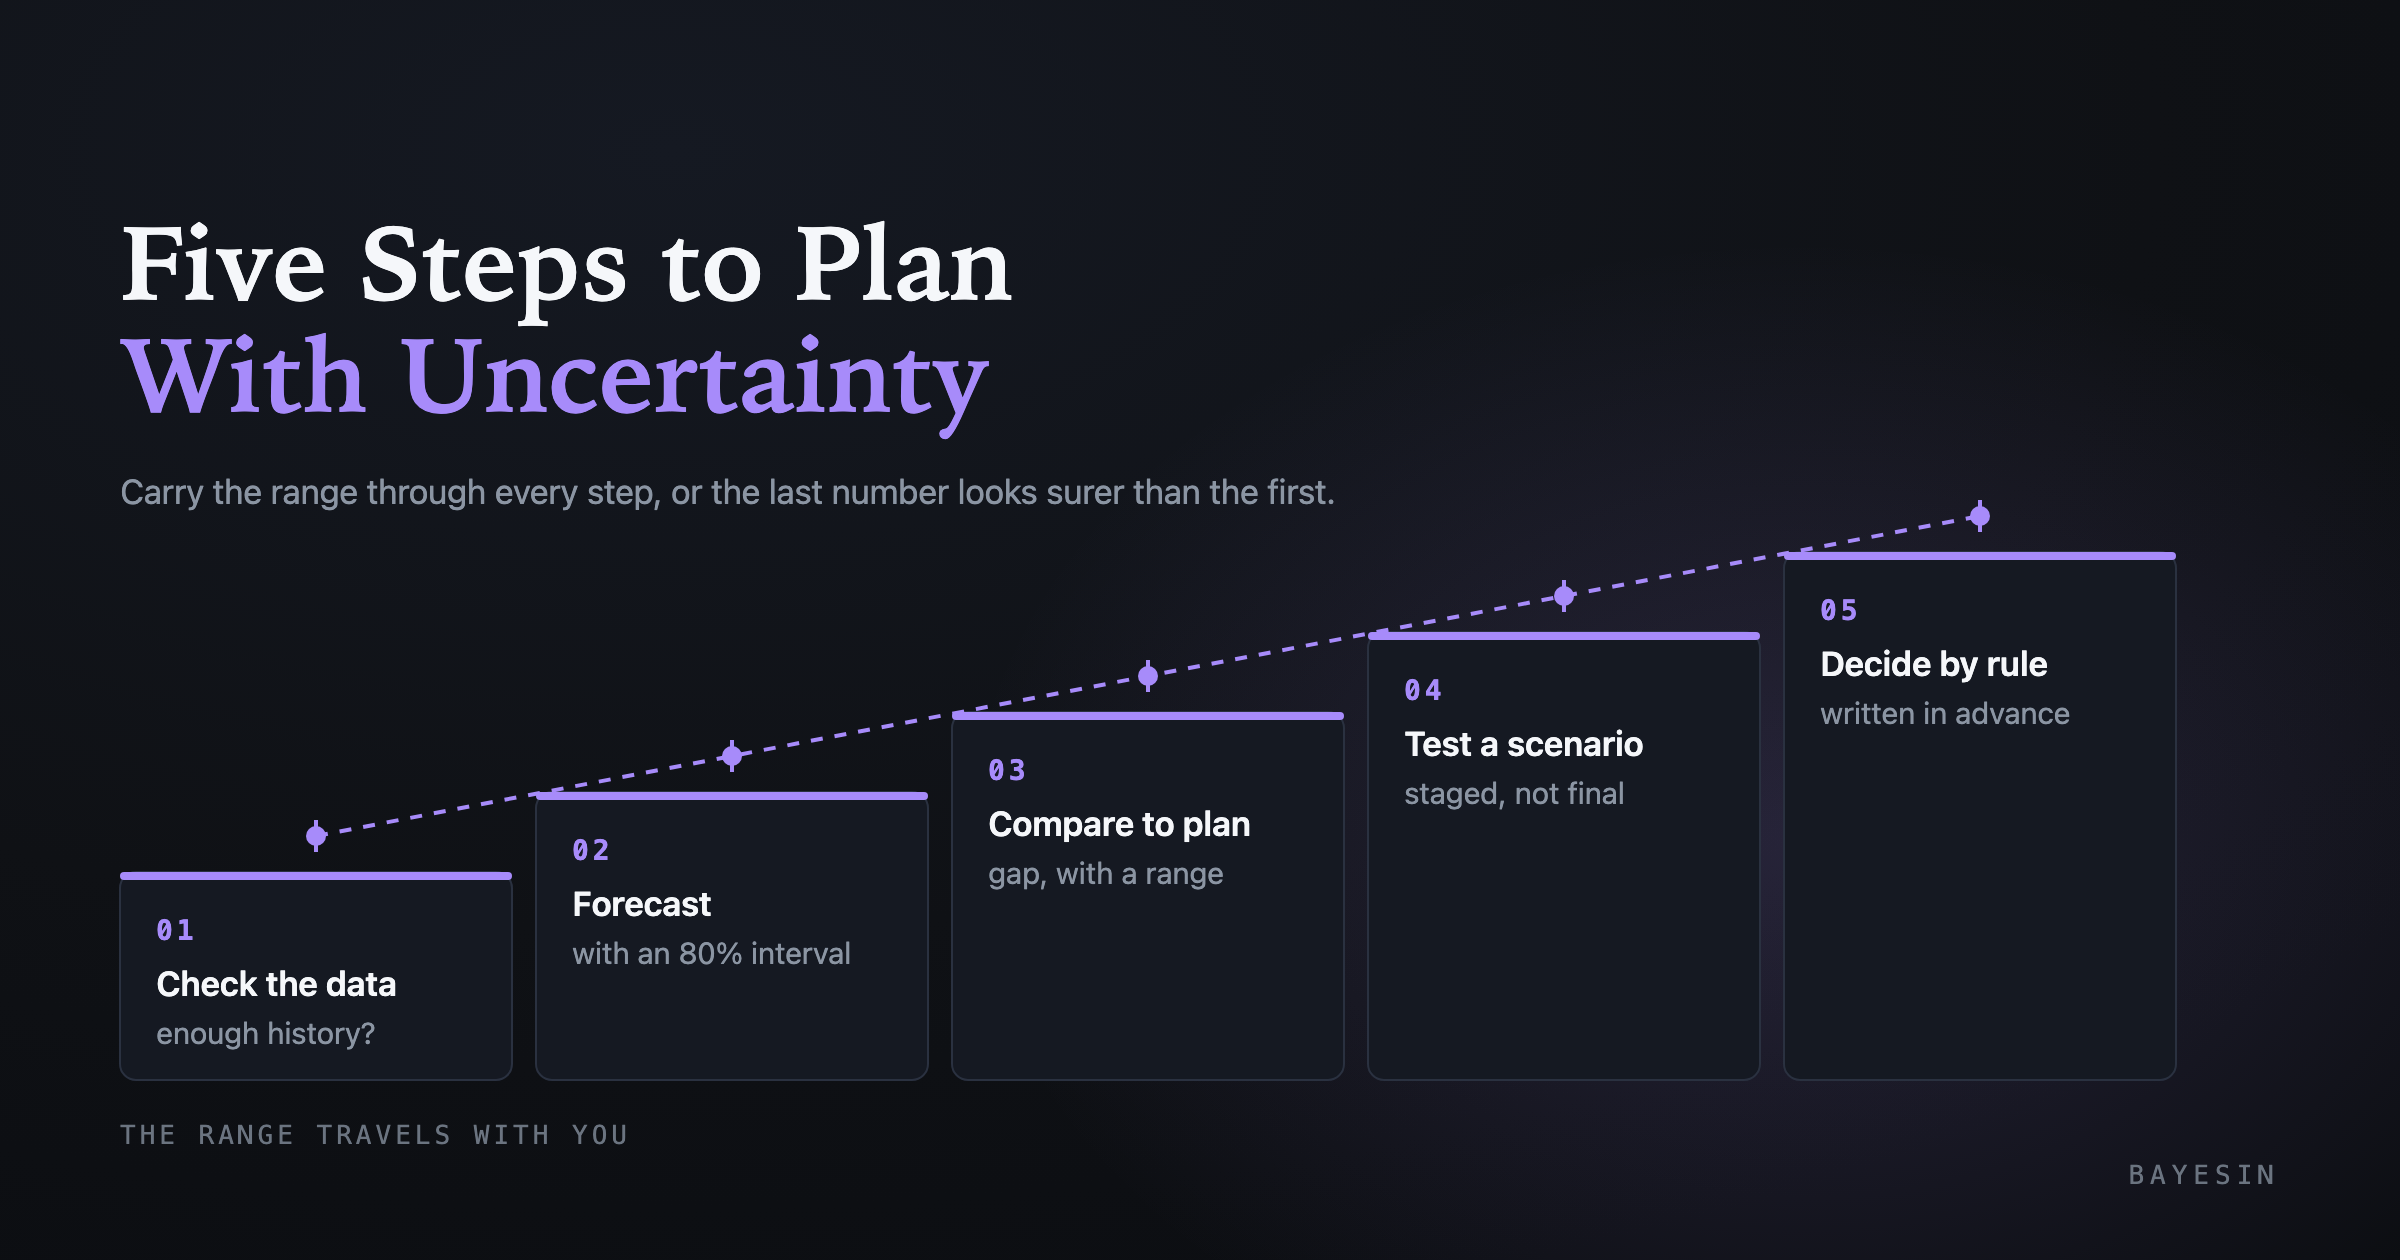
- Planning next quarter takes five steps: check the data, forecast with an interval, compare with plan, test a scenario, and decide by a rule written in advance.
- Carry the interval through every step. A forecast, a gap and a scenario each need a range, or the last number in the chain looks more certain than the first.
- The model's own interval covers noise around its assumptions. Measure error by horizon on held-back weeks to see what it misses.
- A small modeled gain can sit inside a wide interval, so treat it as a staged test and not as a commitment.
- Say what the model leaves out, and bring a decision rule to the finance conversation.
Next quarter's budget usually gets set with a forecast in one hand and a plan in the other. The forecast derives from history, whereas the plan derives from ambition. Between them sits a series of small judgments about which numbers to trust and which to challenge.
This guide is the map I use to make those judgments in order. Marketing budget planning with uncertainty means that each number in the chain keeps its range. Six deeper posts cover the individual steps, and this page summarizes each in a few lines and links to it.
What does marketing budget planning with uncertainty mean?
It means that every number feeding the decision carries a range. The range stays attached as the number moves from forecast to plan to scenario. You still choose a single action, but you choose it knowing how much room the outcome has around the number that justifies it.
Two kinds of interval appear in the method, and they answer different questions. A forecast interval describes where revenue may land if conditions continue, so it describes the world. A scenario interval describes how much a specific action may change that revenue, so it describes your decision. I use the word interval for both and specify which one I mean.
There is a good reason to insist on ranges. Paul Schoemaker reported in MIT Sloan Management Review in 1995 that the typical manager is overconfident and gives ranges that are much too narrow. Showing a range does not appear to cost much trust in return. In 2020, van der Bles and colleagues found in PNAS that trust in a number fell only slightly when uncertainty was shown. The fall was concentrated in verbal expressions.
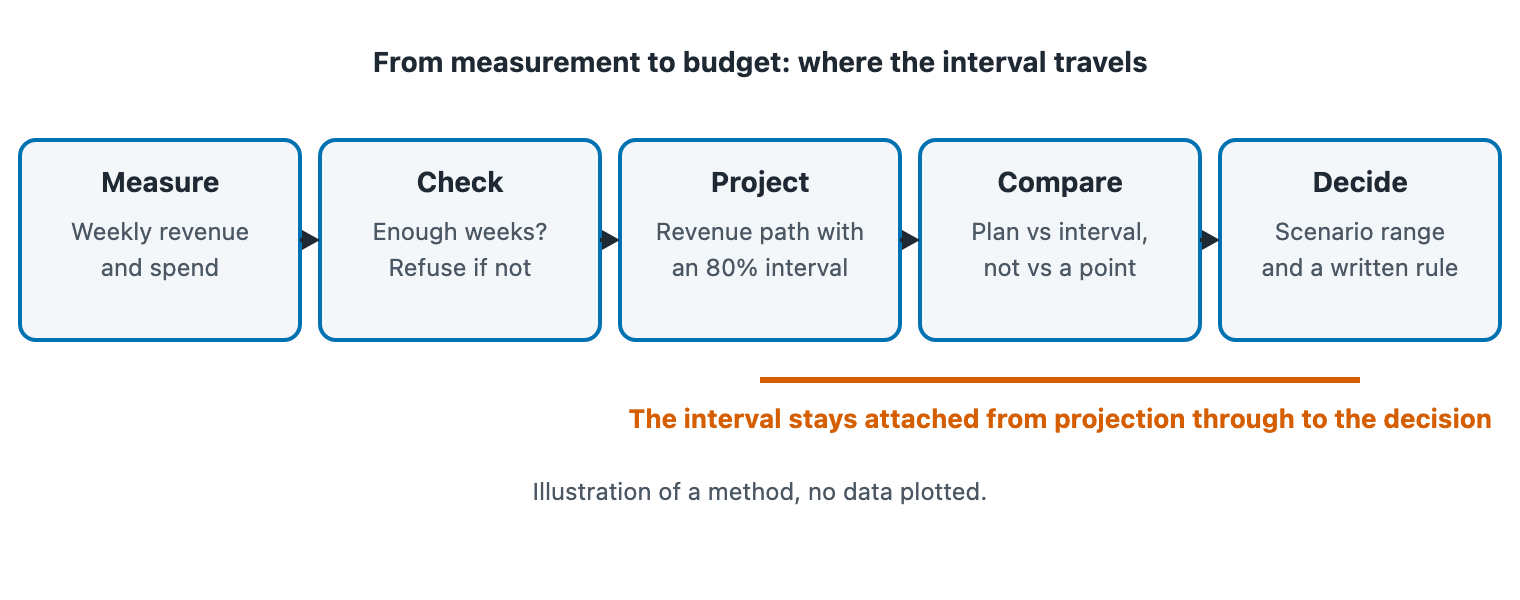
Figure 1. The five steps, and where the interval travels. An illustration of the method, not data.
The five steps at a glance
Each step has one question, one output you can put on a page, and one post that covers it in depth. Table 1 lists them in the order in which I work through them.
- 1. Check — Question it answers: Does the data support a forecast at all?; Output: Pass, or a refusal with a reason; Read more: This page
- 2. Forecast — Question it answers: Where may revenue land, and how firmly?; Output: 80% interval on each week and on the horizon total; Read more: Forecast intervals
- 2b. Horizon — Question it answers: How does error change with distance?; Output: Model band beside measured error; Read more: Error by horizon
- 3. Compare — Question it answers: Is the gap to plan real?; Output: Gap range and chance of a miss; Read more: Forecast vs plan
- 4. Test — Question it answers: Would a different split or total help?; Output: Scenario range against a hold case; Read more: Reallocation, Scenarios
- 5. Decide — Question it answers: What action, and what rule?; Output: One page for finance; Read more: Presenting to finance
Table 1. The five steps and the post behind each.
What must be true of your data before you forecast?
Before you forecast, you need consecutive weekly history, revenue that was measured and not planned, and some variation to learn from. Below a minimum, the honest output is a refusal. My working minimum is 26 weekly rows for a trend forecast and 104 rows for a yearly seasonal shape.
The floors are derived from what the fit requires. In 2021, Hyndman and Athanasopoulos wrote in Forecasting: Principles and Practice that seasonal regression uses one fewer dummy variable than there are categories. Monthly data therefore needs 11. A yearly cycle in weekly data has 52 positions and therefore needs 51 seasonal terms plus the intercept. Two years of data means each position rests on at least two observations.
The four checks I run first
- One row per consecutive week. A missing week shifts every later week's position in the yearly cycle.
- Measured revenue, not plan. A plan exported as a revenue column can fit perfectly and produce a band of zero width.
- Some movement. A flat series has no trend to extend and no variation to measure.
- Enough weeks. At least 26 for trend, and 104 for trend and season.
If a check fails, collect more weeks or use the plan as a labeled assumption instead of a forecast. A model that always produces an answer is no more useful than one that says "not yet". It is simply harder to catch when it is wrong.
Forecasting next quarter with an interval
Fit a linear trend and a yearly seasonal shape together to weekly revenue, usually on the log scale. Read the 80% interval from the spread of the fit's own residuals. Report each week and the horizon total, because the total has its own interval and it is far narrower than the weekly bands stacked.
The log scale allows growth to compound. The FPP chapter on transformations notes that a back-transformed point forecast will usually be the median and not the mean. It adds that back-transformed intervals keep their coverage but are no longer symmetric around the point forecast.
In my synthetic 130-week series, the 26-week total has a median near $4,740 thousand and an 80% interval of $4,531 to $4,954 thousand. That interval is roughly a quarter as wide as the weekly bands added together. The post what a forecast interval tells you that one number can't explains why. It also lists what to ask of any forecast that arrives without an interval.
I cap the horizon at the smaller of 26 weeks and half the history, so a model fitted on 40 weeks receives a 20-week horizon.
Reporting near-term and far-term error separately
Error usually grows with distance, while a seasonal model's own band may not. The band reflects noise around fixed assumptions and cannot see a drifting trend. Reporting the model interval beside the measured error at each horizon exposes the gap between what the model claims and what history shows.
My synthetic backtest illustrates this pattern. The upper edge of the band stayed near 24% above the median at every horizon. Measured median absolute error rose from about 14% at week 1 to 19% at week 26. Coverage of the nominal 80% band fell from 70% to 50%.
The practical rule is to show the first week, the middle, the last and the total. The method, the script and the reporting table are in marketing forecast error by horizon. Errors are scored on held-back weeks, so this step tests the revenue path and not the causal story behind it.
Comparing the forecast with the plan
The gap to plan is the forecast minus the plan, and it needs its own interval. Compute it at the median and at both ends of the forecast interval, then state the chance of landing below plan. I sort each plan into watch, prepare or act, depending on where it sits against the interval.
In my example, three plans trail the median by 1.3%, 3.3% and 7.1%. Their chances of a miss are about 64%, 83% and 98%, so the smallest gaps differ far more in risk than the percentages suggest. The interval also helps separate intent from risk, because a plan may include actions that a revenue-only forecast cannot see.
Set the materiality rule before the numbers arrive, and hold the plan constant for the period. Marketing forecast vs plan variance, with its uncertainty gives the procedure, including a count-based way to check that your miss probabilities were calibrated.
Reallocating a fixed total
Hold the total constant, and move dollars from the lowest marginal return to the highest until the returns are close to equal. Bound each channel's movement and put an interval on each marginal return, so you can tell how firmly the ranking holds.
Meridian's fixed-budget scenario and Robyn's "maximum response" scenario follow the same logic, and Meridian's defaults let each channel move between 70% and 130% of baseline. In my three-channel example, the greedy split raised modeled revenue by 1.0%. The lift had a median of +$4.8 thousand a month and an 80% interval of -$6.4 to +$18.2 thousand, which spans zero.
A gain that small deserves a staged test with a written expectation. The curves, the intervals and the code are in marketing budget reallocation model at a fixed total spend. That post also states precisely what Bayesin's budget simulator does and does not carry through a reallocation.
Building scenarios you can defend
Write every assumption in a ledger, change one thing at a time, and report each result as a range against a hold reference. Fix your decision rule before the run. A scenario is defensible when a skeptic can see what it assumed and where it could be wrong.
A scenario is not a forecast, and it inherits the forecast's interval and adds the uncertainty of the response curves. Keep a dated list of scenarios you rejected, because it stops the set from drifting toward a preferred answer. The Petropoulos review of forecasting practice calls one such distortion "enforcing", in which forecasts are inflated to match financial goals.
Presenting the result to finance
Lead with the decision you are requesting. Then give the range, what would change the answer and what the model does not cover, and end with your decision rule. The method belongs in an appendix, because that order matches the way a finance partner tests a number.
Use numbers and consistent terminology. The Petropoulos review reports that overuse of technical language may reduce understanding and affect perceptions of expertise. Prepare answers to the six questions finance will ask, from revenue versus margin through to what you ruled out. How to present a marketing model to finance tabulates each question with a one-line answer and the ledger row that supports it.
How the steps hand off to each other
The method only works if the interval survives each hand-off, so it helps to know what breaks when it does not. The forecast interval feeds the gap to plan. If you discard it there, a 3% gap reads as a fact, and every conversation about it becomes an argument about a single number.
The same interval feeds the hold scenario, which is the reference for every other scenario. If the reference carries no range, a scenario's improvement is measured against a fixed point that does not exist. The scenario intervals then feed the decision rule, and a rule that sees only medians will approve moves that its own uncertainty cannot support.
The loop closes at the end of the quarter. Actual outcomes are compared with the intervals from step two, and the coverage you observe tells you whether to widen them next time. Each step therefore hands two things forward: a number and the range that qualifies it. When a step cannot produce a range, say so on the page, and label the number as an assumption.
Who owns each step
The five steps rarely belong to one person. In most organizations, the marketing lead owns the plan and the decision. An analyst owns the forecast and the scenarios, and the finance partner tests the result. Table 2 shows the split I would suggest, and it also shows the question each role should ask at every hand-off.
- Marketing lead — Owns: The plan, the decision rule, the staged test; Question to ask at the hand-off: Which zone does the plan fall in, and what is my response in that zone?
- Analyst — Owns: The forecast, the backtest, the ledger; Question to ask at the hand-off: How many weeks of history sit behind this interval, and what does it exclude?
- Finance partner — Owns: Reconciliation and the downside view; Question to ask at the hand-off: Does the modeled contribution tie to booked revenue, and is this revenue or margin?
Table 2. A suggested division of ownership across the five steps.
What does this method not tell you?
It does not tell you what happens if the world changes in ways the model never saw. A forecast built from revenue alone excludes spend, promotions, offers and competitor moves. A single response curve per channel excludes interaction and carryover, and every interval covers noise around assumptions rather than the assumptions themselves.
Four limits deserve to be stated explicitly. First, a trend-and-season forecast assumes that the next six months resemble the last two years. Second, intervals set by judgment or by software tend to be too narrow, as Petropoulos and co-authors note. Third, a model that fits well does not necessarily identify causal effects. As of 2026, Google's Meridian documentation states that the goal in marketing mix modeling is causal inference, and not necessarily to minimize out-of-sample prediction metrics.
Fourth, revenue is not margin, so a reallocation that raises revenue can still lower profit. None of these limits is a reason to skip the method. Together they form the contents of the "what the model does not cover" line on your one-page summary.
How would you run this over one quarter?
Run it as a cycle with five checkpoints, each producing one output you can put on a page. Check the data and forecast early, compare with plan and test one reallocation in the middle, and review actuals against the intervals at the end. Then feed the result into the next quarter.
A thirteen-week schedule
- Weeks 1 to 2: check and forecast. Confirm the data floors, then produce the 26-week forecast with its 80% interval and the horizon total.
- Weeks 2 to 3: compare with plan. Compute the gap at the median and at both interval ends, and classify the plan as inside, near an edge or outside.
- Weeks 3 to 5: scenarios. Write the ledger, run the hold case, one reallocation and one change in total, and record the rejected scenarios.
- Week 6: decide. Bring the one-page summary and the decision rule to finance. Approve a staged move with a written expectation and a review date.
- Weeks 7 to 13: review. As actuals arrive, update the gap and record whether each week landed inside its interval. Keep the old forecasts.
The final step matters most for the next cycle. If far fewer than four in five outcomes land inside your 80% intervals, widen them. If the plans you called an 83% chance of a miss were missed about 83 times in 100, your intervals are calibrated.
Terms used throughout, defined once
The cluster uses one word per concept, so here is the shortlist.
- Interval. A range built so that a stated share of outcomes falls inside it. I use 80%, meaning the 10th to 90th percentile.
- Horizon. How many weeks ahead a forecast reaches.
- Gap to plan. Forecast minus plan, with its own interval.
- Marginal return. The revenue from the next dollar at today's spend.
- Hold scenario. Today's split at today's total, the reference for every other scenario.
- Ledger. A dated one-page table of a scenario's assumptions, sources, ranges and exclusions.
- Staged test. A partial move with a written expectation and a review date.
Frequently asked questions
Do I need a marketing mix model to do this?
No. Forecasting and the gap to plan need only your own weekly revenue history. Reallocation and scenarios need response curves for spend, which a mix model can supply. Without curves you can still record assumptions and ranges, but you cannot rank channels by marginal return with any rigor.
How much history is enough?
My floors are 26 weekly rows for a trend forecast and 104 for a yearly seasonal shape. Below the first, the slope mostly reflects recent weeks, and below the second, seasonal terms cannot be distinguished from noise. With less, collect more weeks and treat the plan as an assumption.
Why an 80% interval and not 95%?
Either is legitimate, and Hyndman and Athanasopoulos say they usually compute both. An 80% interval is narrower and easier to act on, and you can check it sooner because one in five outcomes should fall outside it. Choose one, state it explicitly and use it consistently.
What if my backtest coverage is lower than the stated interval?
Then the model band is too narrow for how your revenue behaves. Widen it to the measured error range at each horizon and label it empirically calibrated. Also say what the model leaves out, because a narrow band often signals change that the model cannot see.
What if finance wants a single number?
Give the median, and say plainly that it is the middle of a range. Offer the low end of the interval as the downside planning number. Then show the decision rule, so that the conversation concerns the action and not which number to print.
Sources
Every statistic in this guide comes from one of the sources below, all retrieved 2026-09-18, or from my own synthetic simulations as described in the text.
- OTexts (Hyndman and Athanasopoulos, 2021), "Prediction intervals"
- OTexts (Hyndman and Athanasopoulos, 2021), "Some useful predictors" (seasonal dummy variables)
- OTexts (Hyndman and Athanasopoulos, 2021), "Forecasting with transformations"
- OTexts (Hyndman and Athanasopoulos, 2021), "Evaluating forecast accuracy"
- arXiv (Petropoulos et al., 2022), "Forecasting: theory and practice"
- MIT Sloan Management Review (Schoemaker, 1995), "Scenario Planning: A Tool for Strategic Thinking" (full text PDF)
- Proceedings of the National Academy of Sciences (van der Bles et al., 2020), "The effects of communicating uncertainty on public trust in facts and numbers"
- Google (2026), "Budget optimization scenarios", Meridian documentation
- Google (2026), "Assess the model fit and the results", Meridian documentation Meta, "Robyn features: budget allocator", Robyn documentation
See it on your own rows.
Bayesin is pre-launch. Join the waitlist and we will reach out as access opens.
Get new posts by email.
New posts only. See privacy for what we keep.