Planning and forecasting
How to present a marketing model to finance
Finance will test a modeled scenario on its range, limits and link to booked revenue. Use a one-page structure and six prepared answers to present it well.
Brandon Cade · Oct 12, 2026 · 8 min read
Key Takeaways
- Lead with the decision you are requesting, then the range, then what would change the answer. Put the method last.
- Show the interval as numbers. Research on public audiences finds that numeric ranges cost little trust and vague wording costs more.
- State what the model does not cover in the first minute, before someone else does it for you.
- Turn each disagreement about an assumption into a row that you can change and rerun.
- Bring a decision rule written before the run, so the meeting concerns the action and not the arithmetic.
You have a modeled scenario and a finance partner who will test it, which is precisely the audience it deserves. A CFO is accustomed to ranges, variances and downside cases, so a model that displays its own range already speaks a familiar language.
This guide explains how to present a marketing model to finance through a one-page structure, a plain explanation of the interval and six prepared answers. The example is synthetic, and every figure is an illustrative teaching value in $ thousands per month.
What does a CFO need from a modeled scenario?
A CFO needs five things: the decision being requested, the range of outcomes and what would change the answer. Finance also needs to know what the model does not cover and which rule you will follow. The method matters less than you might expect, so it belongs at the back of the pack.
Research supports that ordering. In 2022, Petropoulos and co-authors reviewed forecasting practice in "Forecasting: theory and practice" (arXiv 2012.03854). They report that overuse of technical language may reduce understanding of a forecast or advice, which in turn can affect perceptions of expertise and trustworthiness. They also note that explanations can help.
Plain wording is therefore not a courtesy but part of how a number becomes believed. Keep terminology fixed as well, using "marginal return" and "80% interval" consistently, without substituting synonyms halfway through the page.
Finance readers will also look for what the model cannot vouch for. A page that states its limits up front demonstrates that you identified them before anyone else did. That is the most credible position a modeled number can hold.
How to present a marketing model to finance in one page
Use one page with five numbered sections that follow the sequence of a CFO's questions. Open with the decision and show the range, then list what would change the answer and state the model's limits. End with a decision rule, and relegate the methodology, priors and diagnostics to an appendix.
The five sections, filled in
Figure 1 shows the layout I use, and the numbered text below fills it in with the synthetic example.
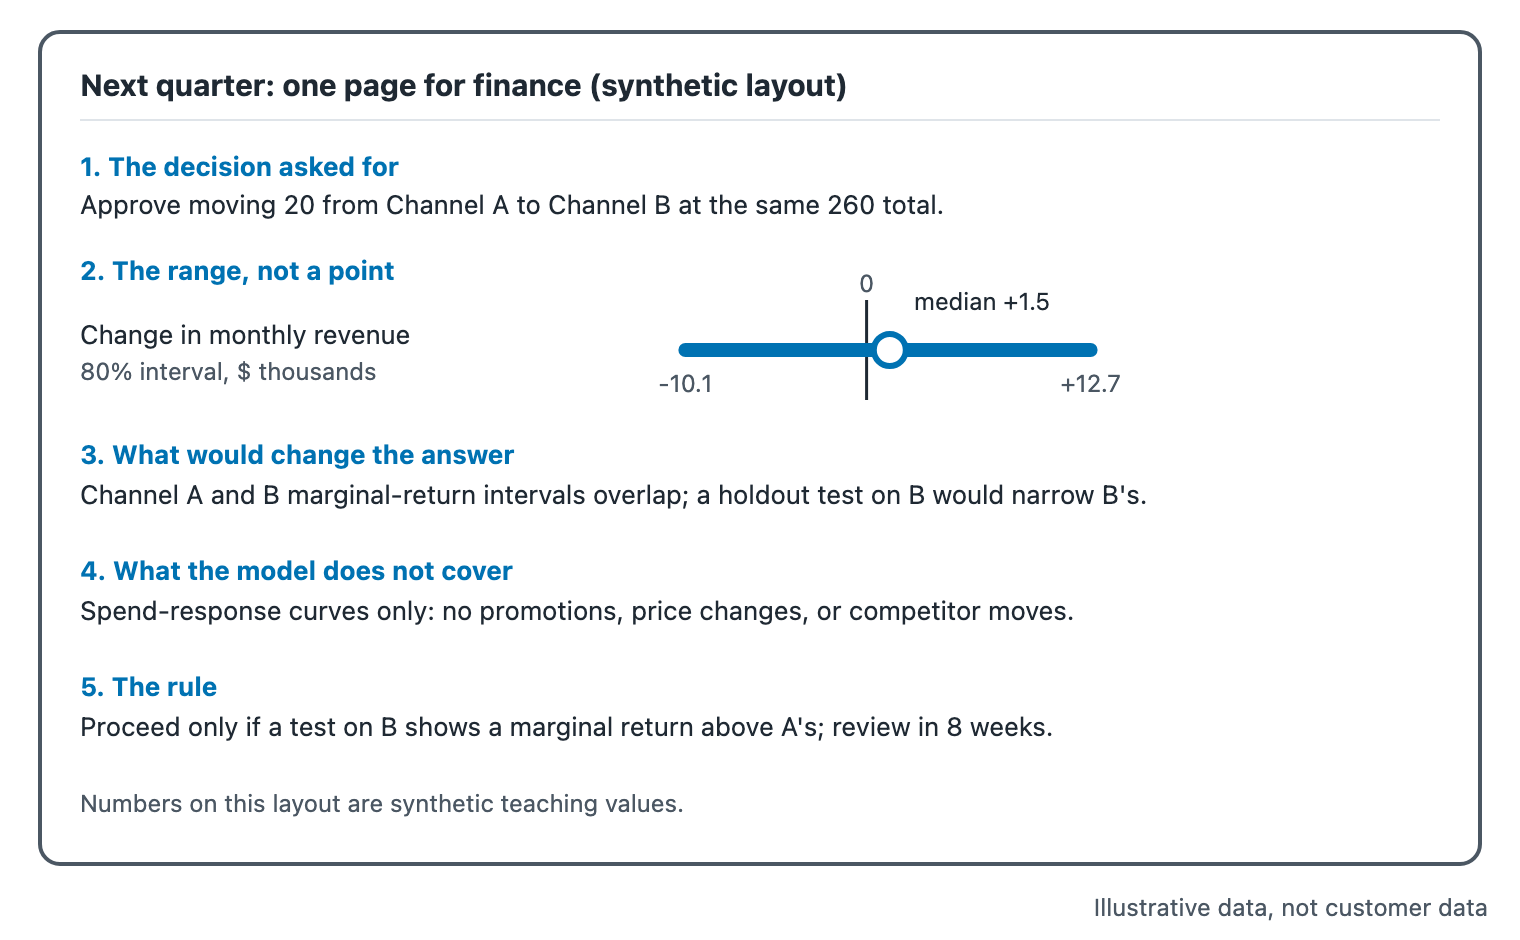
Figure 1. A one-page layout for finance, using synthetic values.
- The decision asked for. "Approve moving $20 thousand a month from Channel A to Channel B, keeping the $260 thousand total."
- The range. "Modeled revenue changes by +$1.5 thousand a month at the median. The 80% interval is -$10.1 to +$12.7 thousand. The change is above zero in about 57% of modeled outcomes."
- What would change the answer. "Channel A's and Channel B's marginal-return intervals overlap. A holdout test on B would narrow B's."
- What the model does not cover. "Spend response only. Promotions, offer changes, competitor moves and channel interactions are excluded."
- The rule. "Proceed at full scale only if a test shows B's marginal return above A's. Review in eight weeks."
The numbers come from my worked example in reallocating budget at a fixed total spend. The ledger behind them, and the method I use to compare scenarios, appear in building a marketing budget scenario you can defend.
This page does not request a substantial commitment. With a range that spans zero, the honest request is a staged test. Asking for exactly what the evidence supports makes the following request easier to approve.
How do you explain an interval to someone who does not read posteriors?
State what the range means in a single sentence and give the numbers. For example: "In four of five modeled outcomes, the change is between minus $10.1 and plus $12.7 thousand." Avoid the word "posterior", and never rely on adjectives such as "likely" without a number beside them.
The available evidence favors numeric expressions. In 2020, van der Bles and colleagues ran five experiments with 5,780 participants. Their PNAS paper, "The effects of communicating uncertainty on public trust in facts and numbers", found that people perceived more uncertainty when it was communicated. Trust in the number and the source fell only slightly, and mostly for verbal expressions of uncertainty.
The same group published a 2019 review in Royal Society Open Science, "Communicating uncertainty about facts, numbers and science". Its abstract reports some evidence that communicating epistemic uncertainty does not necessarily affect audiences negatively. It adds that the impact can vary between individuals and communication formats. These are studies of public audiences, so treat them as a reasonable prior for a finance meeting and watch the room.
Finance teams also have an institutional precedent. In 1998, Britton, Fisher and Whitley explained the Bank of England's Inflation Report fan chart in its Quarterly Bulletin. They noted that the range of uncertainty was based on forecast errors from the previous ten years.
Which questions will finance ask, and how do you answer them?
Prepare short answers to six questions: whether the estimate concerns revenue or margin, how it reconciles to booked revenue, and what the downside is. You should also be ready to describe the track record, the consequences of being wrong and what you excluded. Each answer should point to a row in your ledger or a line on your page.
The six questions in one table
- Is this revenue or margin? — One-line answer: Revenue only, so a margin view is needed before acting.; Ledger row: Exclusions
- How does it tie to booked revenue? — One-line answer: Modeled contributions must not exceed booked revenue.; Ledger row: Baseline
- What is the downside? — One-line answer: About a 43% chance the change is negative, with a low end near -$10 thousand a month.; Ledger row: Baseline (80% interval)
- What is the track record? — One-line answer: Show a backtest, and widen the band if coverage runs short.; Ledger row: Response curves
- What if you are wrong? — One-line answer: The decision rule and the review date limit the cost of an error.; Ledger row: Decision rule, kept beside the ledger
- What did you rule out? — One-line answer: The dated list of rejected scenarios.; Ledger row: Rejected list, kept beside the ledger
Table 1. Finance questions, one-line answers and the ledger row that supports each.
Notes on each answer
Revenue or margin. Say which one the model estimates, because a revenue-based scenario cannot tell you whether the additional revenue pays for its cost. In my synthetic example, raising the total 10% earns approximately $0.80 of modeled revenue per added dollar, which requires a margin view before anyone acts.
Booked revenue. Finance reconciles to the ledger, so begin there. A model's estimated contributions should never add up to more than the revenue actually booked. If they do, the model is claiming credit for money that does not exist, and you should say so before someone else does.
Downside and track record. Give the low end of the interval and its probability. With 57% of draws above zero, "roughly a 43% chance the change is negative, with the low end near minus $10 thousand a month" is a complete answer. To document the track record, show a backtest, whose steps are in marketing forecast error by horizon.
If you are wrong, and what you ruled out. Point to the decision rule and the review date, because a staged move with a written expectation limits the cost of an error. Show the list of rejected scenarios too. The Petropoulos review describes "enforcing", "sandbagging" and "spinning" as known distortions in organizational forecasting, and a dated ledger answers that concern before anyone raises it.
Handling disagreement about an assumption
Treat it as a row to change. Ask the finance partner which value they believe, enter it in the ledger, rerun the scenario and show how the range moves. Either the answer changes, and you have learned something, or it holds, and you have demonstrated that it survives their view.
This approach moves the discussion from opinion to arithmetic. It also keeps you honest, since a skeptical partner is an inexpensive way to test whether your own ranges are too narrow. Judgment-based ranges are often too narrow, as I describe in what a forecast interval tells you that one number can't.
What to leave out of the main page
Leave out anything that does not change the decision. Priors, sampler diagnostics, adstock transformations and curve equations belong in the appendix. The main page should carry one chart or table, no more than five numbers and one paragraph on limits.
If someone asks for the method, provide it, ready and dated, but do not open with it. The people who decide are asking whether the range is credible and whether the action is small enough to try. The appendix answers neither question.
For where this sits in a planning cycle, the pillar guide, Marketing budget planning with uncertainty, in five steps, covers the full sequence.
Frequently asked questions
Should I show the full range or just the median?
Show both. The median gives finance the central expectation, and the interval gives them the downside and the upside. A median alone invites the interpretation that the outcome is certain. The interval costs one line on the page and prevents a harder conversation later.
How much detail on the model is too much?
Anything beyond what changes the decision goes in an appendix. Give the main page one chart or table, five numbers at most and one paragraph on limits, and offer the method on request. If the first question concerns priors, the page has not answered the decision questions.
What if the CFO wants a single number?
Give the median and say plainly that it is the middle of a range. Then offer the low end as the planning number for downside cases. Finance teams already plan with scenarios, so a median with a labeled low end gives them both a reference point and a floor.
What if the interval is very wide?
Say so, and ask for a smaller step. A wide interval is information, because the data cannot yet separate the options. Propose a staged test that would narrow it, which gives finance a decision they can approve now and a review point when new evidence arrives.
Sources
- arXiv (Petropoulos et al., 2022), "Forecasting: theory and practice"
- Proceedings of the National Academy of Sciences (van der Bles et al., 2020), "The effects of communicating uncertainty on public trust in facts and numbers"
- Royal Society Open Science (van der Bles et al., 2019), "Communicating uncertainty about facts, numbers and science", DOI 10.1098/rsos.181870
- Bank of England Quarterly Bulletin (Britton, Fisher and Whitley, 1998), "The Inflation Report projections: understanding the fan chart"
See it on your own rows.
Bayesin is pre-launch. Join the waitlist and we will reach out as access opens.
Get new posts by email.
New posts only. See privacy for what we keep.