Planning and forecasting
Building a marketing budget scenario you can defend
Marketing budget scenario planning works when each assumption is written down and every result is a range. Follow a four-step method with a filled-in ledger.
Brandon Cade · Oct 11, 2026 · 9 min read
Key Takeaways
- A defensible scenario has four parts. Write the assumptions down, change one thing at a time, show a range, and set the decision rule before the run.
- Keep a "hold the current plan" scenario as the reference against which every other scenario is measured.
- A scenario is not a forecast. It answers "what if you did this?" under stated assumptions, and it should say what it leaves out.
- Ranges set by judgment tend to be too narrow, so widen them or test them against a backtest.
- Record the scenarios you rejected, because that record keeps the set honest.
A what-if question is easy to ask and hard to answer well. "What if I moved 20% out of Channel A?" produces a number in a spreadsheet within minutes. The harder task in marketing budget scenario planning is producing a number that survives the first difficult question in the room.
This guide offers a four-step method and a filled-in assumptions ledger. The numbers are synthetic and illustrative, and all dollar figures are in thousands per month.
What makes a budget scenario defensible?
A scenario is defensible when someone who disagrees with it can see exactly what it assumed and where it could be wrong. That requires four practices: write the assumptions down before the run, and change one thing at a time. Report the result as a range, and fix the decision rule in advance.
In 1995, Paul Schoemaker described scenario planning as a disciplined method for imagining possible futures. His article, "Scenario Planning: A Tool for Strategic Thinking", appeared in MIT Sloan Management Review. He also warns that managers are prone to overconfidence and tunnel vision. In his study, confidence ranges widened by approximately 50% on average once people had built scenarios.
A 2022 review adds evidence on how scenarios work in practice. In "Forecasting: theory and practice" (arXiv 2012.03854), Petropoulos and co-authors say scenarios have been widely used in corporate planning since the 1960s. They describe scenarios as tools for communication within organizations.
The same review also flags an important catch. In experiments it summarizes, seeing an opposing scenario increased forecasters' confidence in their initial predictions. A scenario set can therefore make people more sure, not less. Pairing each scenario with a range, and with a written note of what it omits, works against that effect.
Prefer the short plain-English version? Read Making a budget call when you can't be sure.
What goes into an assumptions ledger?
An assumptions ledger is a one-page table with a row for each thing the scenario takes as given. Each row states the value, its source, its range and the date it was last checked. Anyone can then challenge a single row without having to challenge the whole scenario.
For a spend scenario, I include these rows: the baseline forecast, spend by channel, the response curves, the bounds, the exclusions and the period. The exclusions row matters most, because it is where you say plainly what the model cannot see. A reader who finds the exclusion on the page trusts the range more, not less.
The ledger, filled in
Table 1 fills in a ledger for the three-channel example from reallocating budget at a fixed total spend. Every value is synthetic.
- Baseline — Value in this example: Modeled revenue $470 per month at the current split; Source: Curves anchored on current revenue; Range or bound: 80% intervals from 20,000 marginal-return draws
- Spend by channel — Value in this example: A 120, B 80, C 60; total 260; Source: Assumed current budget; Range or bound: Total held fixed, except in the total-change scenario
- Response curves — Value in this example: Saturating, one per channel; Source: Fitted through current revenue and marginal return; Range or bound: Marginal return 0.78, 1.02, 0.60; spread of 0.35 assumed
- Bounds — Value in this example: Each channel between 70% and 130% of current spend; Source: Google's Meridian default for fixed budgets; Range or bound: Model-optimal split cuts C to 68%, so it breaks the bound
- Exclusions — Value in this example: Promotions, offers, competitor moves, channel interaction, carryover, margin; Source: My scope choice; Range or bound: Not modeled
- Period — Value in this example: One month, USD thousands; Source: Plan calendar; Range or bound: Compare only against a plan in the same currency and period
Table 1. An assumptions ledger for the synthetic example.
What the bounds row reveals
The bounds row shows why the ledger pays for itself. Written down, it reveals that the model-optimal split moves Channel C to 68% of its current spend, which lies just outside the 70% limit. Without the ledger, that breach would pass unnoticed by everyone reading the result.
Meridian's documentation gives the fixed-budget defaults that let each channel move between 70% and 130% of its baseline allocation. Whatever limits you choose, record them, because moves beyond the range of observed spend are extrapolation.
Marketing budget scenario planning: run and compare
Run every scenario against a common reference and change one thing at a time. Report each result as a change from the reference, with an interval. The reference is the "hold" scenario, which is today's split at today's total, and every other row is read as better or worse than that.
Two families of scenario
Both Meridian and Robyn document scenario types of this kind. Meridian separates fixed-budget scenarios from flexible-budget ones that target a return threshold. Robyn separates "maximum response" for a given total from a "target efficiency" scenario that also solves for the budget. Keep the two families apart, because they answer fundamentally different questions about the budget.
Reading the results
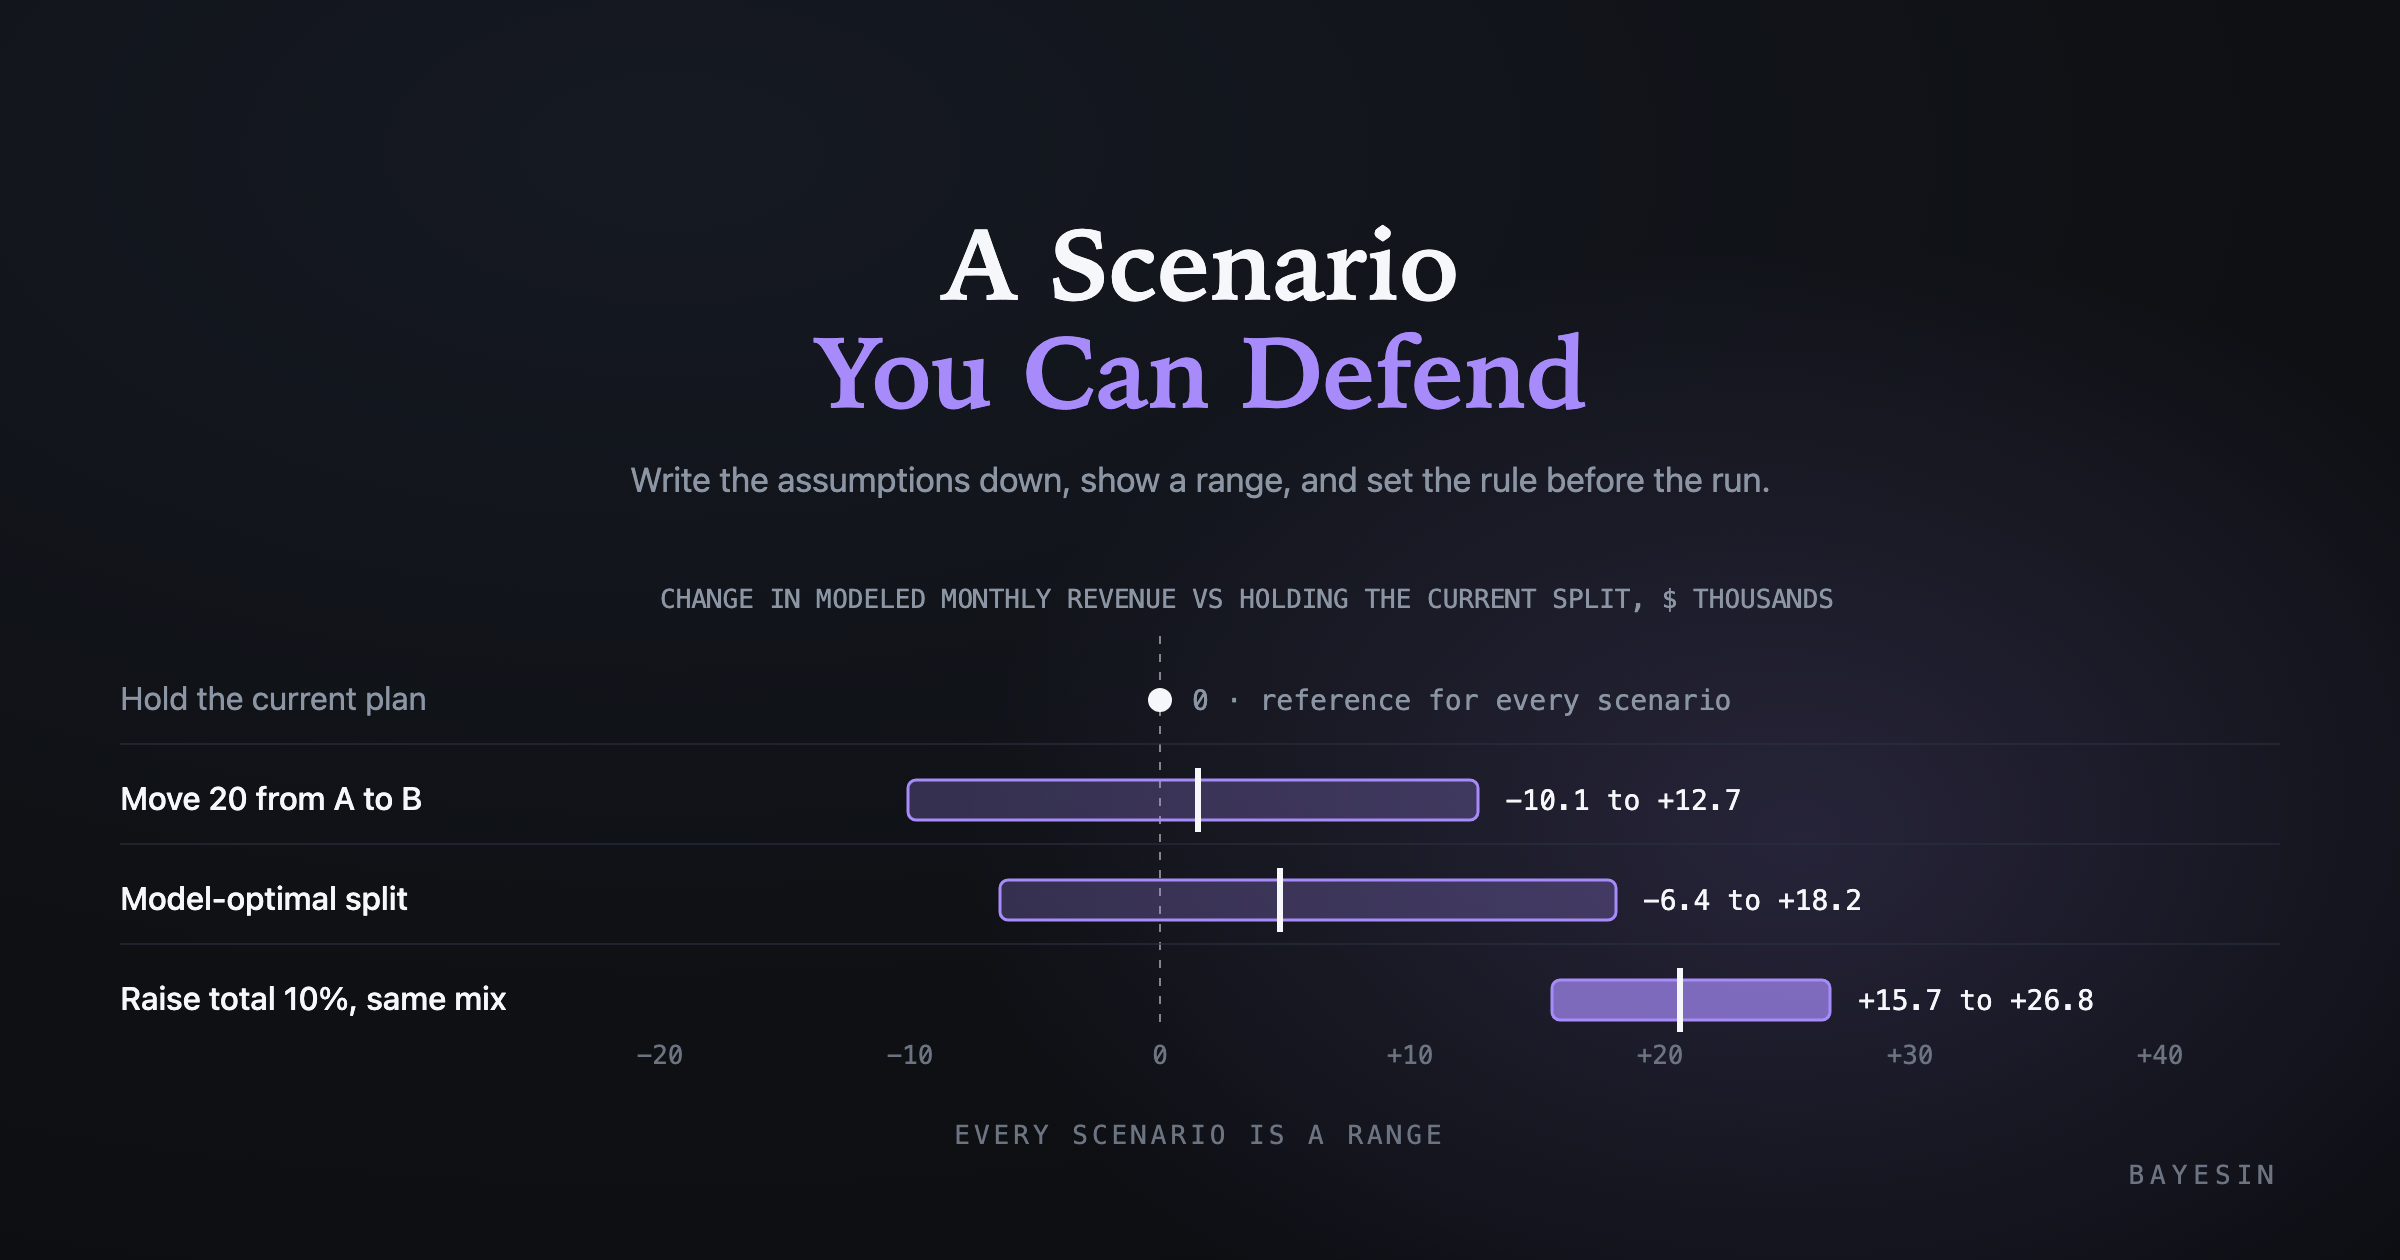
Table 2 shows three scenarios beyond the hold case. The reference is current spend of $260 thousand and modeled revenue of $470 thousand per month.
- Move 20 from A to B — Total spend: 260; Change in revenue vs hold (median): +1.5; 80% interval: -10.1 to +12.7; Share of draws above zero: 57%
- Model-optimal split — Total spend: 260; Change in revenue vs hold (median): +4.8; 80% interval: -6.4 to +18.2; Share of draws above zero: 69%
- Raise total 10%, same mix — Total spend: 286; Change in revenue vs hold (median): +20.8; 80% interval: +15.7 to +26.8; Share of draws above zero: 100%
Table 2. Intervals reflect assumed uncertainty in each channel's marginal return.
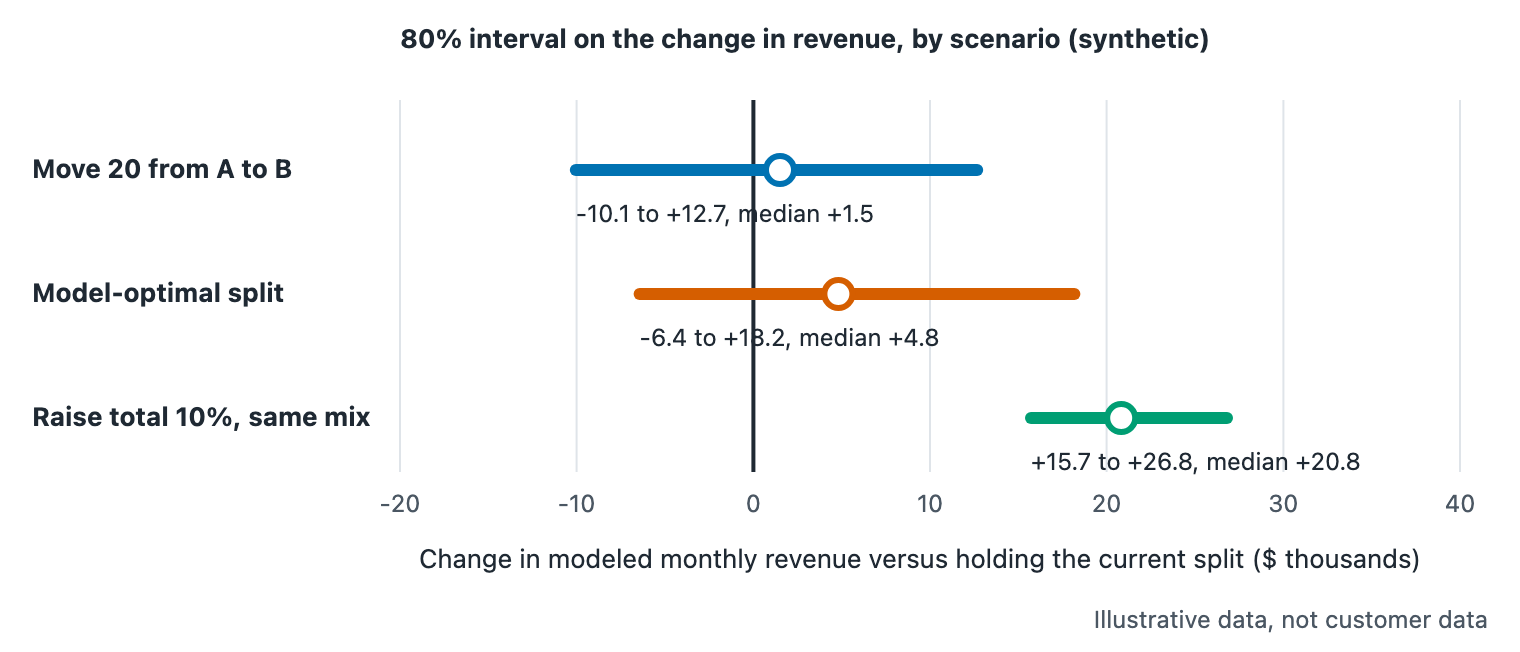
Figure 1. Synthetic scenario results as a change from holding the current split.
The third row needs a particular caution. Adding spend to any rising curve produces more modeled revenue, so "above zero in 100% of draws" is close to guaranteed by construction. It says nothing about whether the extra $26 thousand pays back. The median gain of $20.8 thousand equals roughly $0.80 of revenue per added dollar. That is a different question from a reallocation, and it requires a margin view.
How wide should the ranges be?
The ranges should be as wide as your evidence supports, and you should test them against history. Include uncertainty from the baseline forecast, whose measured error grows toward the far end of the horizon, and from the response curves. If you set a range by judgment, widen it, because judgment ranges tend to be too narrow.
The baseline matters because scenarios inherit its uncertainty, as the forecasting literature makes clear. In 2021, Hyndman and Athanasopoulos wrote in Forecasting: Principles and Practice that prediction intervals usually lengthen as the forecast horizon increases. In my synthetic backtest, measured error at week 26 was much wider than at week 1, as I show in marketing forecast error by horizon. Keep scenario horizons short wherever you can.
The response curves matter because they carry the marginal returns. Meridian's documentation states that its model generates a joint posterior for every estimated metric, including return and response curves. If your model produces intervals, use them; if it does not, sample plausible marginal returns as I did and say that you did.
In 2020, van der Bles and colleagues ran five experiments with 5,780 participants. Their PNAS paper found that people perceived more uncertainty when it was communicated, while trust in the number and its source fell only slightly. That is a fair reason not to trim a wide range merely to keep the room comfortable.
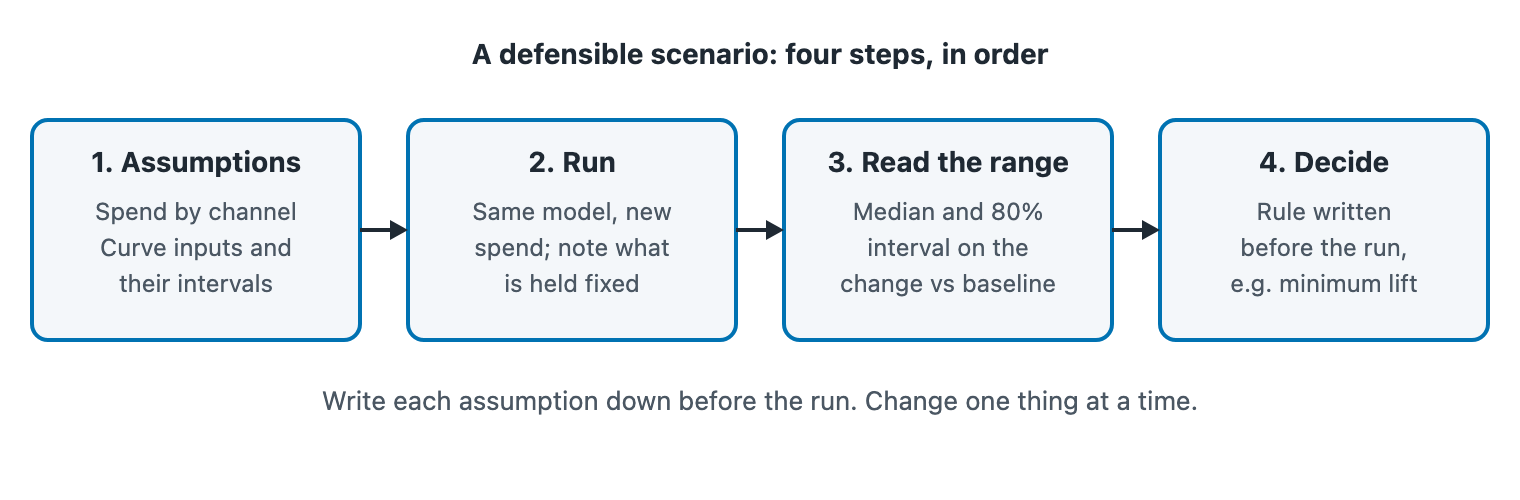
Figure 2. The four steps of a defensible scenario.
What decision rule should you set first?
Set the rule before you see the result, and state which interval outcome leads to which action. A simple version has three branches. Proceed when the low end of the interval is above zero. Run a staged test when the median is positive but the interval spans zero. Stop when the median is not positive.
The thresholds are a team choice and not an established standard. What matters is that they exist in writing before the numbers arrive. Otherwise the same result can be read as a green light on Monday and a caution on Friday, depending on who wants the outcome.
Applied to Table 2, both reallocation scenarios fall in the "staged test" branch, because their intervals span zero. The 10% increase would pass a revenue-only rule, and it would need a margin check before anyone acts. The rule does not decide for you, but it tells you precisely what kind of decision you are making.
The next step is to place the result in front of someone who controls the budget. I cover how to structure that conversation in how to present a marketing model to finance.
Keeping scenarios honest
Keep a short list of every scenario you considered, including those you dropped and why. Keep the hold scenario in every comparison, and fix the plan for the period before you start. These habits stop a scenario set from drifting toward the answer that someone already wanted.
The Petropoulos review describes known distortions in organizational forecasting, including "enforcing", in which forecasts are inflated to align with financial goals. Scenarios can be bent in the same way, for example by selecting a favorable set of assumptions after the fact. A ledger dated before the run and a rejected-scenario list make that easy to see.
In the example, the rejected list has one entry. "Cut Channel C to zero" was rejected because it falls below the 70% bound and outside the observed spend.
Frequently asked questions
How many scenarios should I build?
Enough to cover the real options, and no more. A short set is easier to read: the hold case, one or two reallocations, and perhaps a change in total. Each additional scenario makes the comparison harder and gives you another chance to choose the one you already preferred.
Is a scenario the same as a forecast?
No. A forecast projects what happens if conditions continue. A scenario says what happens if you take a specific action under stated assumptions. A scenario can build on a forecast, so it inherits the forecast's interval and adds the uncertainty of the response curves.
What if my model has no intervals?
Then vary the key assumptions by plausible amounts and report the spread, stating that the spread is an assumption. That is weaker than a model-based interval, but it is still better than a single number. Also flag which assumptions you varied and which you held fixed.
How often should I revisit a scenario?
Revisit it when new actuals arrive or an assumption changes. A monthly cadence suits many teams. Keep each version dated so that you can see how the range moved over time and whether earlier calls held up against what happened.
Sources
Every statistic in this post comes from one of the sources below, all retrieved 2026-09-18, or from my own synthetic example as described in the text.
- MIT Sloan Management Review (Schoemaker, 1995), "Scenario Planning: A Tool for Strategic Thinking" (full text PDF)
- arXiv (Petropoulos et al., 2022), "Forecasting: theory and practice"
- Google (2026), "Budget optimization scenarios", Meridian documentation
- Meta, "Robyn features: budget allocator", Robyn documentation
- OTexts (Hyndman and Athanasopoulos, 2021), "Prediction intervals"
- Google (2026), "Bayesian inference", Meridian documentation
- Proceedings of the National Academy of Sciences (van der Bles et al., 2020), "The effects of communicating uncertainty on public trust in facts and numbers"
See it on your own rows.
Bayesin is pre-launch. Join the waitlist and we will reach out as access opens.
Get new posts by email.
New posts only. See privacy for what we keep.