Planning and forecasting
Marketing forecast vs plan variance, with its uncertainty
A forecast that trails plan by 3.3% may or may not be a miss. Learn to compute marketing forecast vs plan variance with an 80% interval and act on what it says.
Brandon Cade · Oct 15, 2026 · 8 min read
Key Takeaways
- The gap to plan is the forecast minus the plan. It needs an interval of its own, or a 3% gap cannot be distinguished from noise.
- Compute the gap at the median and at both ends of the forecast interval, then state the chance of landing below plan.
- A plan inside the interval is a call to watch. A plan outside it is a call to act or to revise the plan.
- Part of any gap is intent, because the plan may include actions that a forecast built from revenue history alone does not contain.
- Set a materiality rule before the numbers arrive, so the same gap receives the same response every month.
Most planning reviews place the plan and the latest forecast side by side and assign the difference between them a color and a percentage. That is a reasonable start, but it omits the question every reader asks next, namely whether the gap is real.
This guide explains how to attach an interval to marketing forecast vs plan variance and how to act on what the interval indicates. The example uses synthetic numbers in $ thousands, labeled as such.
What is the gap to plan?
The gap to plan is the forecast for a period minus the plan for that period, so a negative gap means the forecast trails plan. The forecast is a distribution rather than a single value. The gap is therefore also a distribution, with a median, an interval and a probability of being favorable or unfavorable.
Finance teams already use a version of this concept. Wall Street Prep's guide to budget-to-actual variance analysis defines a favorable variance as actuals that come in better than the measure they are compared with. It advises against the words "higher" and "lower", because a higher expense can be an unfavorable variance to profit.
The same discipline applies here: say "favorable" or "unfavorable", state the sign convention once, and apply it consistently every month. Then add what a single number cannot carry, which is your degree of certainty about the sign.
Computing forecast vs plan variance with an interval
Compute the gap at three points, the forecast median and the low and high ends of the interval, by subtracting the plan from each. Then estimate the probability that the total lands below plan by counting the proportion of simulated or modeled totals that fall short.
The five steps
In 2021, Hyndman and Athanasopoulos noted in Forecasting: Principles and Practice that they usually report 80% and 95% intervals. I use 80% here.
- Take the forecast total for the plan period, with its 80% interval.
- Subtract the plan from the median, the 10th percentile and the 90th percentile.
- Express each gap in dollars and as a percentage of plan.
- Find the share of the forecast distribution that sits below plan. That share is the chance of missing.
- Place the plan on the interval and note whether it falls inside or outside.
A worked example with three plans
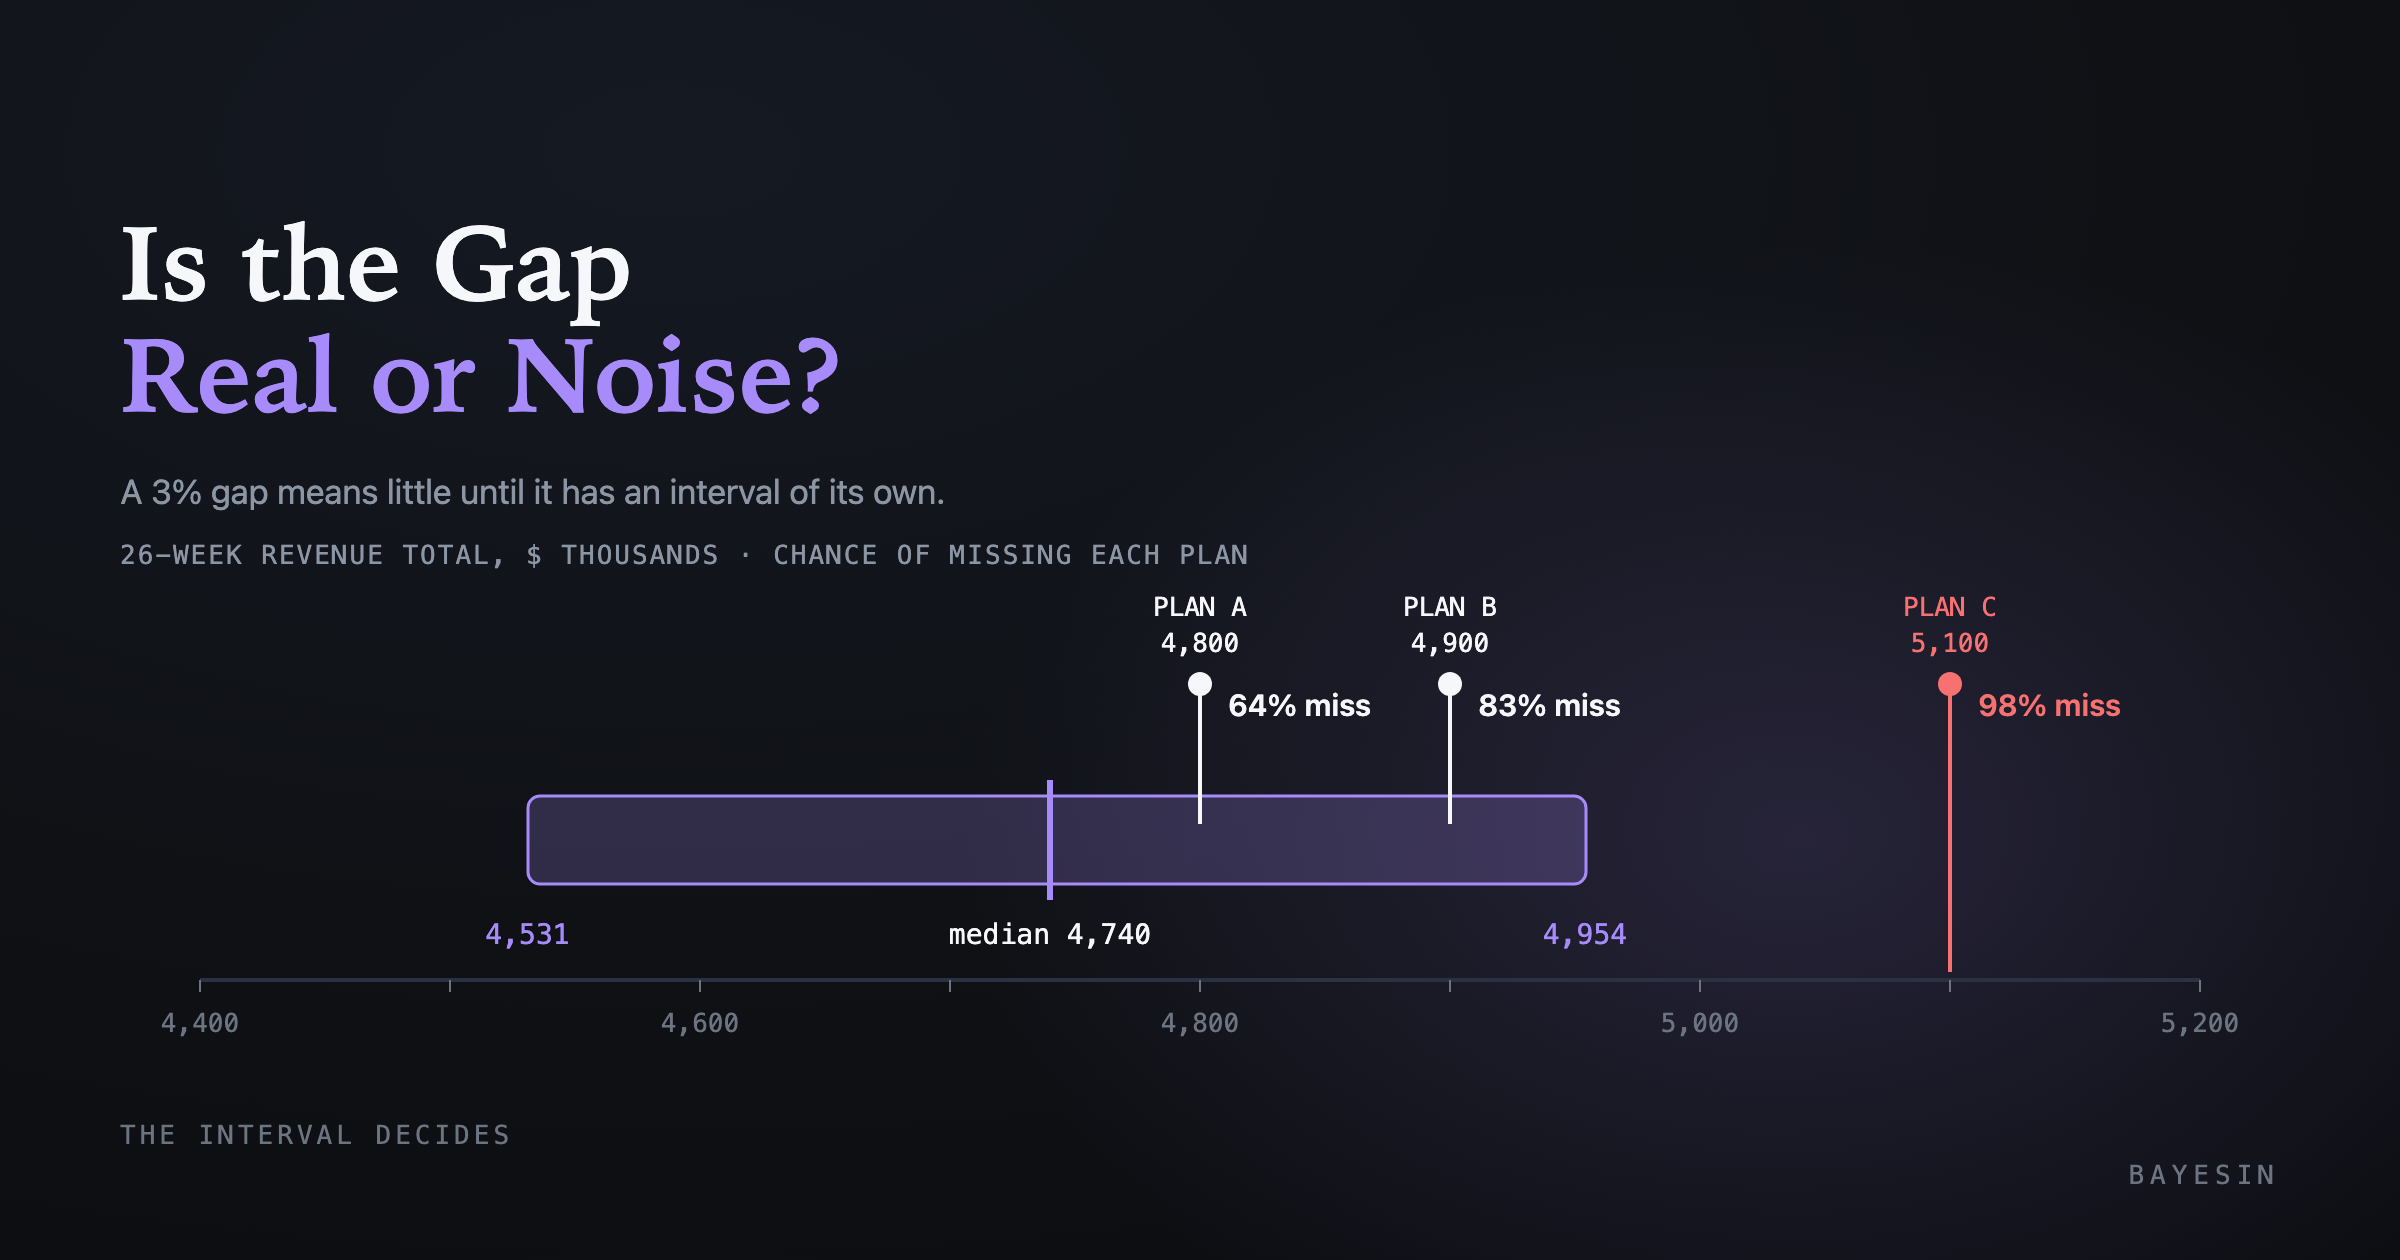
The example uses the synthetic 26-week forecast from what a forecast interval tells you that one number can't. Its median total is $4,740 thousand, and its 80% interval runs from $4,531 to $4,954 thousand. I obtained the interval by simulating 20,000 futures from a fitted trend-and-season model on synthetic data. Suppose three plans are on the table.
- A — Plan total: 4,800; Gap at median: -60 (-1.3%); Gap range (80%): -269 to +154; Chance of missing plan: about 64%
- B — Plan total: 4,900; Gap at median: -160 (-3.3%); Gap range (80%): -369 to +54; Chance of missing plan: about 83%
- C — Plan total: 5,100; Gap at median: -360 (-7.1%); Gap range (80%): -569 to -146; Chance of missing plan: about 98%
Table 1. Gap = forecast minus plan; percentages are relative to plan.
Read the rows in order. Plan A trails the median by 1.3%, but its gap range spans zero, so a modest outperformance is entirely possible. Plan B's range crosses zero only at the top. Plan C's whole range is negative, so the forecast says a miss is close to certain.
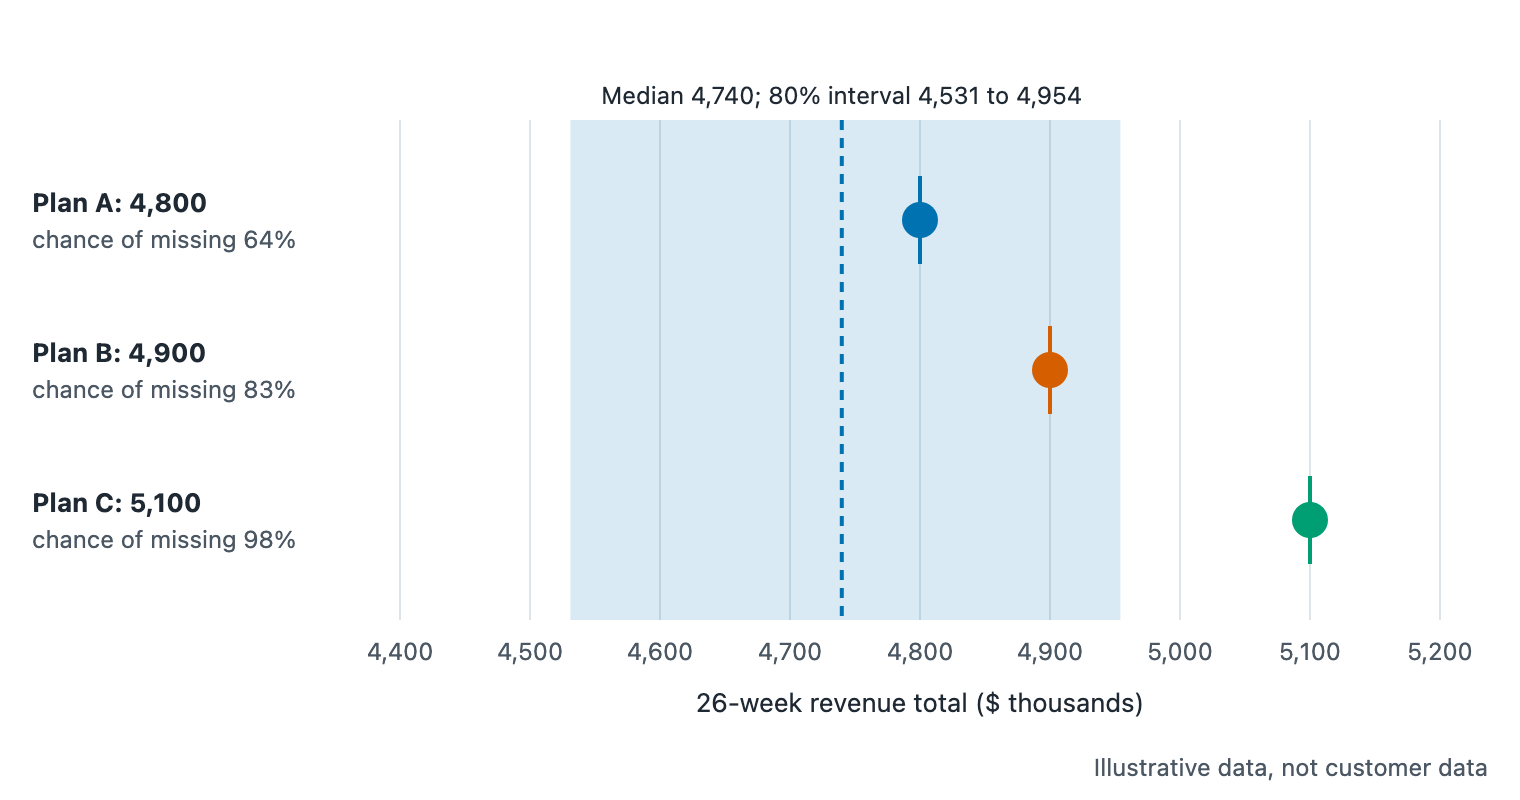
Figure 1. One synthetic 26-week forecast interval with three candidate plans placed against it.
Notice that A and B have gaps of only 1.3% and 3.3%, which might both receive an amber flag in a color-coded report. The interval distinguishes them, because one is close to a coin flip and the other is a likely miss. A point comparison cannot reveal that difference.
How do you decide which gaps need action?
Decide before the numbers arrive, because a gap needs action only when it is large enough to matter and unlikely enough to be noise. Use the interval for the second test and a materiality rule for the first. Documented in advance, the rule prevents the same gap from provoking different reactions in different months.
Wall Street Prep makes the first point plainly. Its guide notes that a small miss on a line item in the millions may not matter. Analysts should set thresholds for what is worth investigating. For the second test I use three zones.
- Plan inside the interval, near the median. Watch. The gap is within ordinary variation.
- Plan inside the interval, near an edge. Prepare. A miss (or a beat) is likely but not certain, so arrange the response in advance.
- Plan outside the interval. Act, or revise the plan. The forecast says the plan is improbable under current conditions.
The zones matter because they attach a response to a probability, which is easier to defend than a threshold on a raw percentage. In the example, Plan A is a "watch". The 3.3% gap in Plan B is a "prepare", and the 7.1% gap in Plan C is an "act".
Why do plans and forecasts disagree in the first place?
Plans and forecasts disagree because they answer fundamentally different questions. A forecast projects what happens if conditions continue. A plan states what the organization intends to achieve, often including actions absent from the historical record. Some of any gap is therefore intent, and some is genuine risk.
There is also a behavioral explanation. In 2022, Petropoulos and co-authors reviewed forecasting practice in "Forecasting: theory and practice" (arXiv 2012.03854) and described three well-documented distortions.
In "enforcing", forecasts are inflated to match sales or financial goals. In "sandbagging", sales are underestimated so people are rewarded for beating them. In "spinning", forecasts are shaped to obtain a favorable reaction from colleagues.
An interval helps with all three, because it makes a stretched target visible as a plan near or beyond the edge of what history supports. It does not claim that the target is wrong, since stretch goals can be entirely sensible when chosen knowingly.
One simple method separates intent from risk. List the actions that the plan assumes and the forecast does not, such as additional spend, a launch or a change to offers. Attach an estimate to each with its own range, then compare the total with the gap. The post on marketing forecast error by horizon shows why the far end of the plan period deserves the widest caveat.
What to report each month
Report the most recent gap, its range, the chance of a miss and how each has changed since last month. As actuals arrive, part of the period is no longer uncertain, so the interval on the remaining total narrows. Show the plan as a line, the year-to-date actuals as fact, and the remainder as a forecast with a band.
Hold the plan constant for the period, because moving it to match the forecast removes the signal that the report was built to show. When the interval is wide, say so directly. In 2020, van der Bles and colleagues found in PNAS that people perceived greater uncertainty when it was communicated. Their trust in the number and the source fell only slightly. A finance reader who sees "-3.3%, range -369 to +54" learns more than one who sees "-3.3%, amber."
Check that your gap calls were calibrated
Refresh the forecast on a schedule and keep the old ones, so you can test whether your miss probabilities were themselves calibrated. The chapter on time series cross-validation in Forecasting: Principles and Practice describes how to score forecasts made from earlier origins.
The test uses simple counts. Among periods where you reported roughly an 83% chance of a miss, about 83 in every 100 should have been missed. Among periods reported at 64%, about 64 in 100 should have been missed. If the observed share differs greatly from the stated one, the intervals are too narrow or too wide. With only a dozen periods, treat the count as a rough guide.
For the whole path from measurement to a decision, start from Marketing budget planning with uncertainty, in five steps. When a gap points to a change in spend, building a marketing budget scenario you can defend shows how to test the response. The conversation that follows is covered in how to present a marketing model to finance.
Frequently asked questions
Is the gap interval just the forecast interval shifted by the plan?
For a fixed plan, yes, because the plan is a constant and subtracting it moves the whole interval without changing its width. If the plan itself is uncertain, such as a target tied to a launch date, the gap interval is wider than the forecast interval.
What does "83% chance of missing plan" mean?
It means that in the modeled distribution of outcomes, about 83 of every 100 futures land below the plan. That is a statement about the model, not a promise. If the model omits change that matters, the true chance can differ, which is why I check calibration against past periods.
Should I compare against the median or the low end?
Look at both, and state which one you use for what. The median is the central expectation, so it suits reporting. The low end of the interval suits downside planning, such as deciding how much spend to hold in reserve. Reporting only one hides the other half of the story.
What if the interval is wider than the gap?
Then the data cannot distinguish the gap from ordinary variation, and the honest report says so. In the example, Plan A's gap of -1.3% sits inside a range of -269 to +154. Wait for additional actuals, or reduce the uncertainty through experimentation.
Sources
- Wall Street Prep, "Budget to Actual Variance Analysis"
- arXiv (Petropoulos et al., 2022), "Forecasting: theory and practice"
- Proceedings of the National Academy of Sciences (van der Bles et al., 2020), "The effects of communicating uncertainty on public trust in facts and numbers"
- OTexts (Hyndman and Athanasopoulos, 2021), "Prediction intervals"
- OTexts (Hyndman and Athanasopoulos, 2021), "Time series cross-validation"
See it on your own rows.
Bayesin is pre-launch. Join the waitlist and we will reach out as access opens.
Get new posts by email.
New posts only. See privacy for what we keep.