Attribution vs MMM
Incrementality vs attribution: what credit cannot tell you
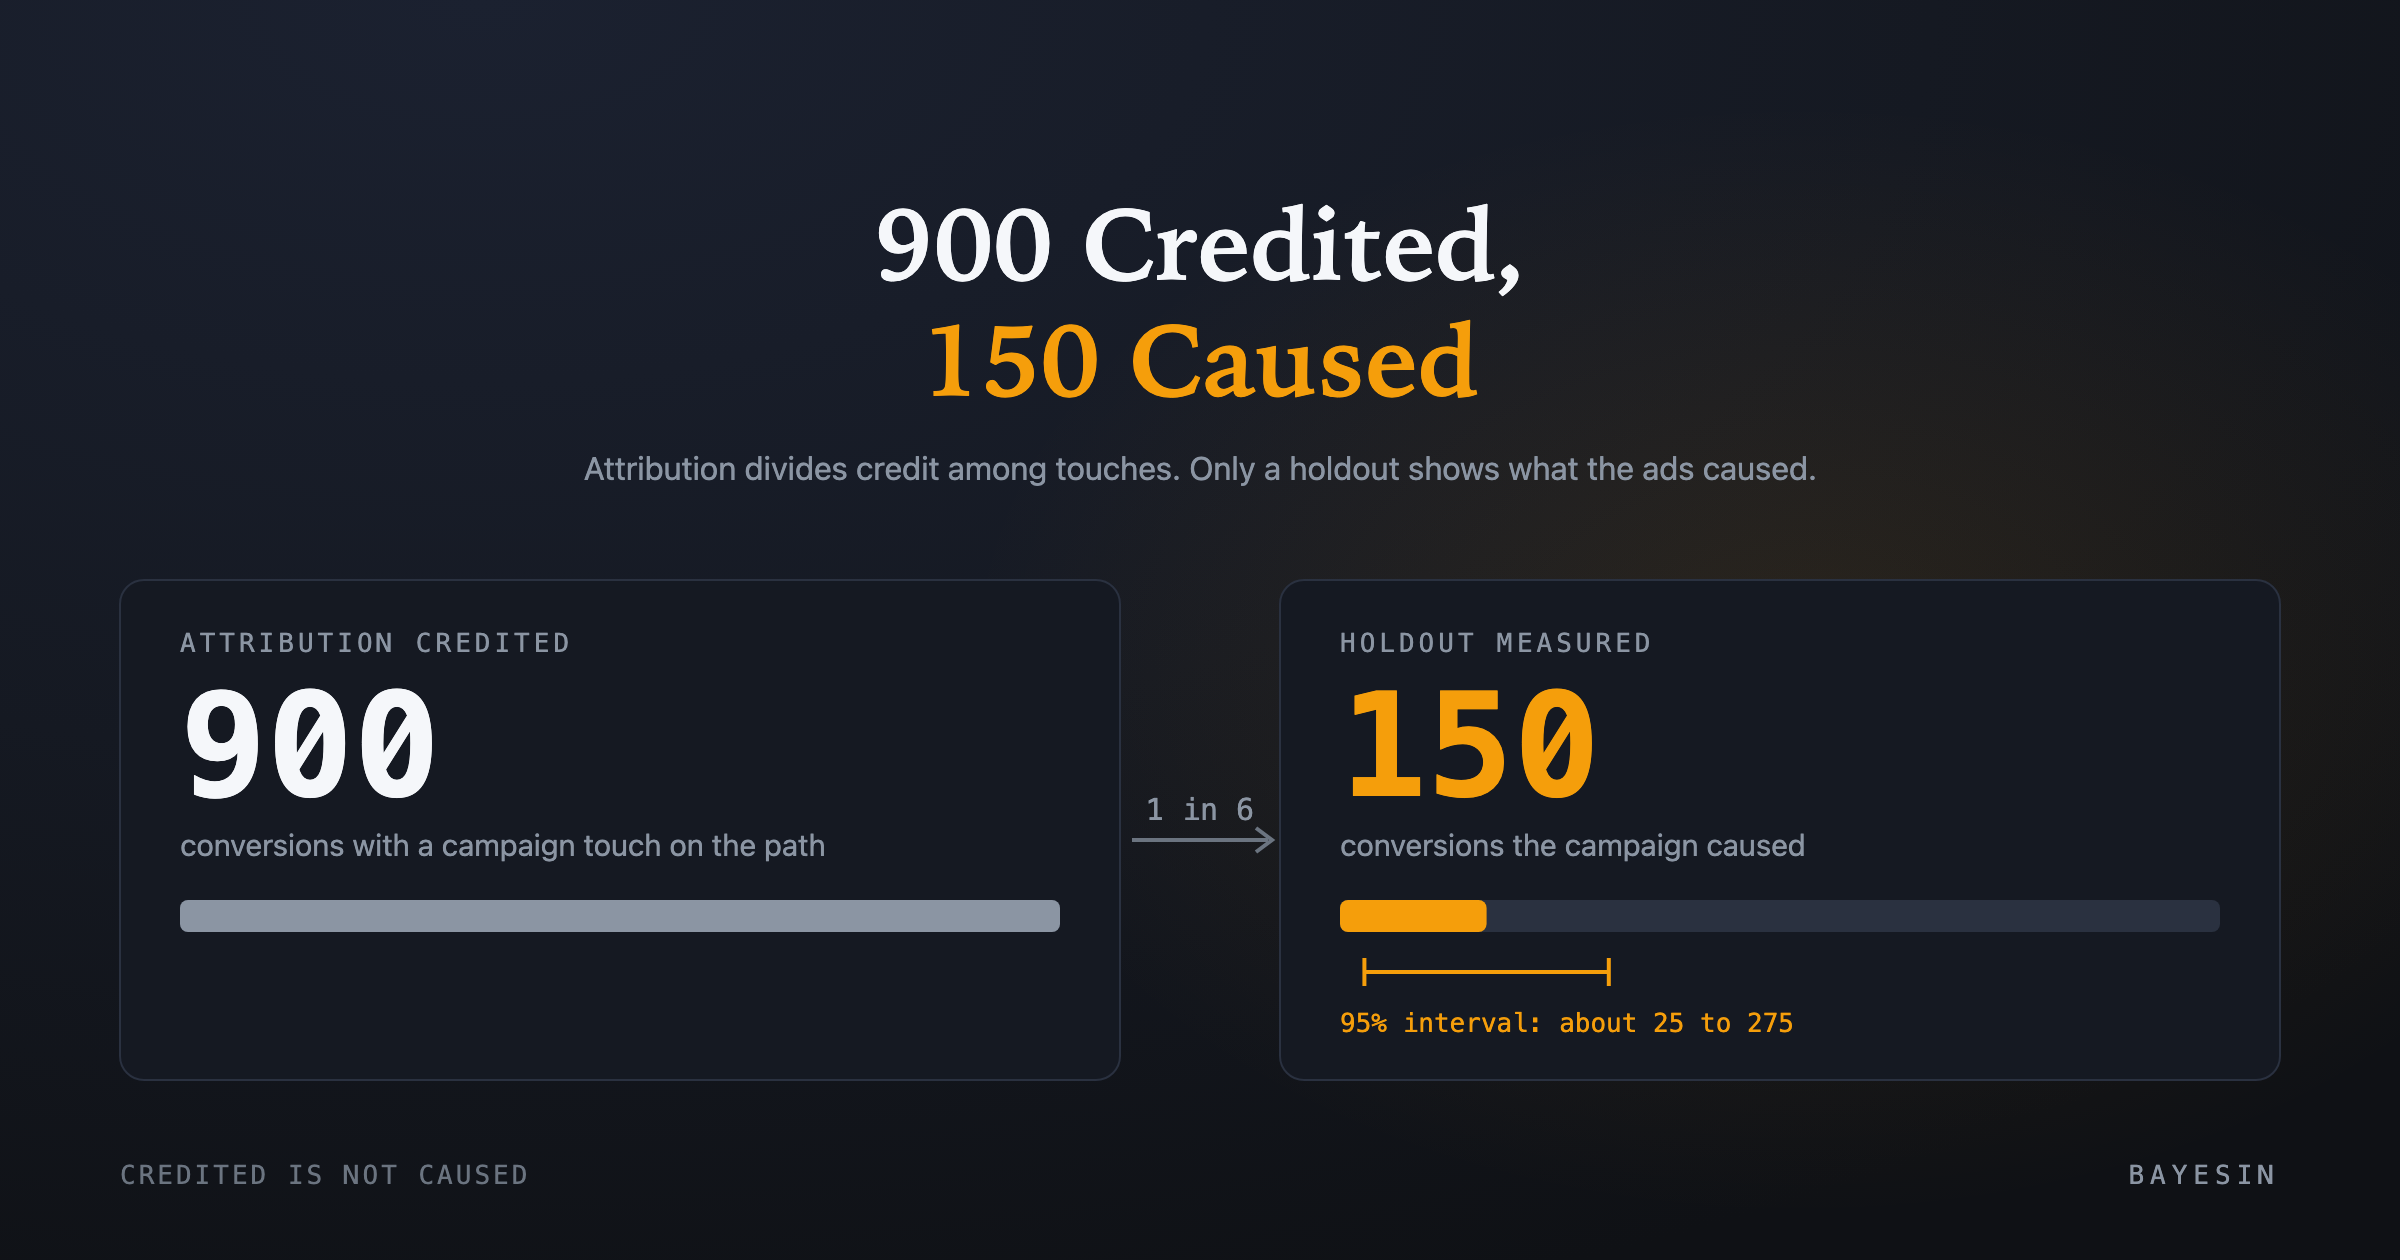
Incrementality vs attribution in one synthetic test: attribution credited 900 conversions, but a randomized holdout measured 150, with an interval of 25 to 275.
Brandon Cade · Sep 19, 2026 · 8 min read
Key Takeaways
- Attribution divides credit among touches that happened. Incrementality asks how many conversions would not have happened without the ads.
- -The two numbers can differ a lot. In my synthetic test, attribution credited 900 conversions, while the randomized holdout measured 150, with a 95% interval of about 25 to 275.
- Experiments are informative but noisy and narrow. Published field experiments show wide intervals on return.
- The strongest setup uses tests to calibrate a media mix model, and uses attribution to describe journeys.
A credit table answers a real question, which is which touches sat on the path to each conversion. It cannot answer a different one: what would those customers have done if the campaign had never run? The distinction between incrementality vs attribution comes down to those two questions, and this post separates them with a worked example.
Incrementality vs attribution: what is the difference?
Incrementality is the number of conversions your advertising caused, meaning conversions that would not have happened without it. Attribution divides credit for conversions that did happen. The first compares against a counterfactual, while the second only describes observed touches, so they can differ by a wide margin.
Google frames its Conversion Lift tool the same way. It defines lift as "the increase in conversions that are caused by the presence of the ad." The tool compares a treatment group that sees ads with a control group that does not (Google Ads Help). That definition is the yardstick I use in this post.
Notice what attribution lacks, which is a control group. Every person in an attribution table has a journey, and nobody in it stands in for what would have happened without the ads. Without that comparison, no credit rule can turn description into cause.
Why a credit table cannot show cause
A credit table cannot show cause because ads are not assigned at random. Platforms target people who are already likely to buy, so people who see ads differ from people who do not before any ad runs. Credit rules inherit that selection, whatever weights they use.
The evidence comes from experiments. The pillar page summarizes the largest comparison, in which observational methods often failed to reproduce randomized results (Gordon and colleagues). Attribution is one of those observational methods, so its limit is a limit on what any rule can do.
What does the gap look like in a worked example?
In a synthetic holdout test, attribution credited a campaign with 900 conversions while the experiment measured 150. Both numbers are valid answers to different questions, and the gap is the part of the credit that would have happened anyway. Illustrative numbers, not real customer data.
Suppose you randomize 200,000 people into two equal groups. Group one sees the campaign and group two is held out. In the treatment group, 2,150 people convert, and in the holdout group, 2,000 do. The difference, 150 conversions per 100,000 people, is the campaign's incremental effect.
Meanwhile, an attribution report credits the campaign with 900 conversions, because 900 of the 2,150 converters had a campaign touch on their path. Only about one in six of those, 150 of 900, was caused by the campaign. The other 750 would probably have happened without it.
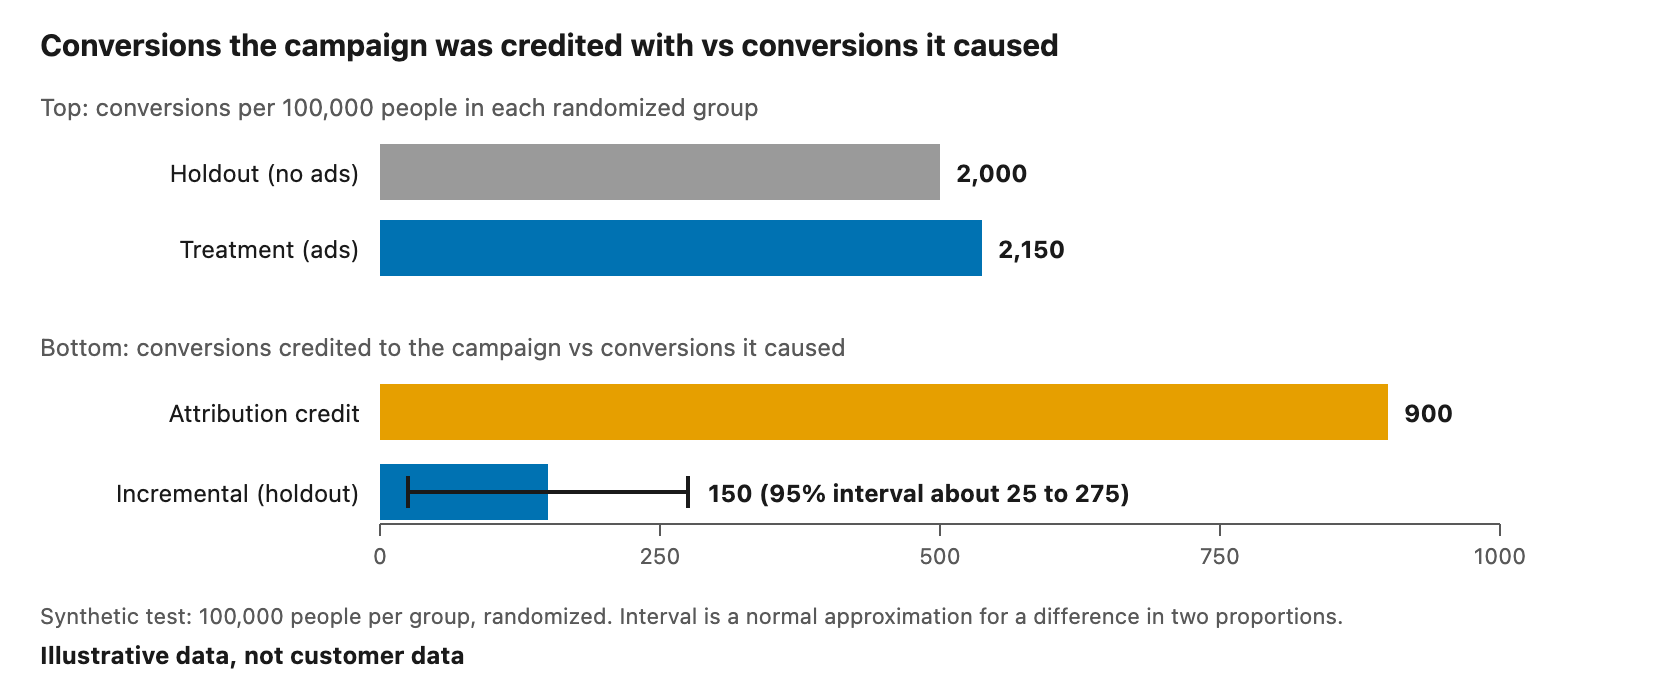
Synthetic holdout test. Attribution credit versus incremental conversions, with a 95% interval on the increment.
How wide is the interval?
The interval is wide. A normal approximation treats the difference between two conversion rates as bell-shaped, which is accurate at these sample sizes. Under it, the 95% interval on the 150 runs from about 25 to 275. A single test at this size cannot separate a small effect from a large one.
That width is normal for advertising experiments, and it is why I show the interval. A test reports a confidence interval, a range built so that 95% of such ranges would cover the true value across repeated tests. A media mix model reports a credible interval, a range that holds the true value with 95% probability given its data and assumptions.
Why experiments are hard to read
Experiments are hard to read because advertising effects are small relative to the noise in individual sales. Lewis and Rao analyzed 25 large field experiments in 2015. The median confidence interval on return on investment was over 100 percentage points wide. They also reported that informative experiments can require more than 10 million person-weeks, which can make them costly or infeasible for many firms.
The reason is variation. Sales across individuals are highly dispersed. A coefficient of variation, meaning the standard deviation divided by the mean, of 10 was common in their data. Their conclusion was still positive, because randomized experiments inject new, unbiased information into the market.
That is the right way to hold both facts. A test is unbiased, but a single test may be imprecise. Plan the sample size before you launch, and report the interval when you finish. Treat a wide interval as an honest answer rather than a failed test.
How incrementality tests are run
Tests randomize either people or places. A user-level test holds out a random share of people from ads, while a geographic test assigns whole regions to treatment or control. Both compare outcomes between groups, and the comparison is what makes the estimate causal rather than descriptive.
Google's Conversion Lift documentation lists both: one is user-based, and the other creates groups from aggregated geographical data. The geo approach has a longer history. In 2011, Vaver and Koehler at Google described randomly assigning non-overlapping regions to control or treatment (Google Research).
- What is randomized — User-level test: People; Geo test: Regions
- Data needed — User-level test: Exposure records for individuals; Geo test: Aggregated outcomes by region
- Exposure to tracking limits — User-level test: Higher, since it needs user-level records; Geo test: Lower, since it uses regional totals
- Typical trade-off — User-level test: More units, so usually tighter intervals; Geo test: Fewer units, so usually wider intervals
A summary of the two designs. The last row is a general statistical tendency, not a measured result.
Which one you choose depends on what data you have and can hold out. For a shorter version first, the plain-English page on holdout tests covers when one is worth running. If the correlation-versus-cause idea is new, correlation vs cause with a coffee shop explains it without any statistics.
What can a single experiment not tell you?
A single experiment covers one channel, one window and one level of spend. It cannot say what happens at a different budget, months later, or across the whole mix. Those are limits of scope, not flaws, and they are why tests work best inside a wider measurement approach.
Google's Meridian documentation makes the same point. It notes that models and experiments differ in scope, timing and duration. Experiments may cover only a fraction of total spend, and short ones might miss long-term effects because of adstock decay (Google for Developers).
Adstock is the lingering effect of advertising after the spend stops. If an effect lasts eight weeks and your test runs for three, the test will understate it. That is one more reason to keep the interval and the test duration on the same slide.
How do tests and media mix models work together?
The most defensible setup uses experiments to calibrate a media mix model. The model covers every channel and every week. The experiment supplies causal evidence for one slice, which the model can then treat as a prior, so each covers the other's blind spot.
Both open-source engines from the large platforms document this workflow. Meridian's CalibrationBuilder translates incrementality experiment results into ROI priors for paid media channels. Meta's Robyn guide strongly recommends using experimental and causal results to calibrate a media mix model.
Attribution stays useful in this picture. It describes journeys, feeds funnel reporting, and reconciles to platform numbers. The pillar page explains how the three methods divide the work. To see how credit totals relate to finance figures, read Reconciling attribution to the ledger.
Do tests still work without cookies?
Yes, and that is one reason to invest in them. A geographic test uses aggregated regions rather than user-level identifiers, and a media mix model uses weekly totals. Neither depends on following individuals across sites, so browser and app privacy changes touch them less than they touch journey-level attribution.
The Robyn guide makes the same point about models: they do not need user-level data and run on aggregated data such as campaign-level figures. For the dated details of what changed in browsers and apps, see Measurement without cookies: what survives.
Frequently asked questions
Is incrementality the same as attribution?
No. Attribution divides credit among observed touches, while incrementality measures the difference in outcomes between people who saw ads and comparable people who did not. The first describes what happened on each path, and the second estimates what the ads caused. Both are useful, and neither replaces the other.
How big does an incrementality test need to be?
The size depends on your conversion rate and the effect you hope to detect. Lewis and Rao found that informative tests can require more than 10 million person-weeks. Estimate the sample size in advance from your baseline conversion rate, and expect that small effects may need a longer test.
What is a holdout test?
A holdout test withholds ads from a randomly chosen group and compares its conversions with a group that saw them. The difference is the incremental effect. Randomization is the key step, since it makes the two groups comparable before the campaign starts.
Can a media mix model measure incrementality?
A media mix model estimates how revenue responds to spend using aggregated data, so it can estimate incremental contribution with an interval. Experiments can calibrate it. Its accuracy depends on data quality and variation in spend, so read its output as an estimate with a range.
Sources
- Google Ads Help, "About Conversion Lift"
- Gordon, Zettelmeyer, Bhargava and Chapsky, "A Comparison of Approaches to Advertising Measurement: Evidence from Big Field Experiments at Facebook," Marketing Science 38(2)
- Lewis and Rao, "The Unfavorable Economics of Measuring the Returns to Advertising," Quarterly Journal of Economics 130(4)
- Vaver and Koehler, "Measuring Ad Effectiveness Using Geo Experiments," Google Research
- Google for Developers, "Set custom ROI priors using past experiments," Meridian documentation
- Meta, "Analyst's guide to MMM," Robyn documentation
See it on your own rows.
Bayesin is pre-launch. Join the waitlist and we will reach out as access opens.
Get new posts by email.
New posts only. See privacy for what we keep.