Attribution vs MMM
Attribution vs marketing mix modeling: when each one fits
Attribution vs marketing mix modeling: six rules split one channel's credit from 2.5% to 33.3%. See what each method answers, needs and cannot show you.
Brandon Cade · Sep 17, 2026 · 13 min read
Key Takeaways
- Attribution divides credit among touches on journeys you can observe. It describes; it does not show cause.
- A media mix model estimates how revenue responds to spend, using aggregated weekly data. An incrementality test measures what ads caused in one experiment. Each answers a different question.
- Rule-based attribution credit can swing widely with the rule. In a synthetic example, one channel's share ranged from 2.5% to 33.3% across six models.
- The strongest setup combines all three: tests calibrate the model, the model sets the budget split, and attribution describes journeys.
- Whatever the method, ask for the assumptions and the interval, and reconcile the total to the ledger.
The most useful first question in the debate of attribution vs marketing mix modeling is not which method is better. It is which decision you are about to make. The two methods answer different questions, on different data, with different limits, and neither is a rival for the other's job. This page maps those differences so that you can match the method to the decision.
Attribution vs marketing mix modeling: what is the difference?
Attribution divides credit for each conversion among the touches that came before it, using journey-level data. A media mix model estimates how total revenue responds to spend by channel, using aggregated data over time. Attribution describes paths, whereas a media mix model estimates response and reports an interval.
The two also differ in the data they need. Attribution needs touches linked to conversions through an identifier, while a media mix model needs weekly totals of revenue and spend. Meta's Robyn guide states the second point plainly: media mix modeling does not need user-level data and runs on aggregated data, such as campaign-level figures.
Google describes its open-source model, Meridian, as helping answer three questions about historical return, response curves and future budget allocation (Google for Developers). Those are budget questions, and attribution's questions are about journeys. Experiments add a third kind of question, which concerns cause.
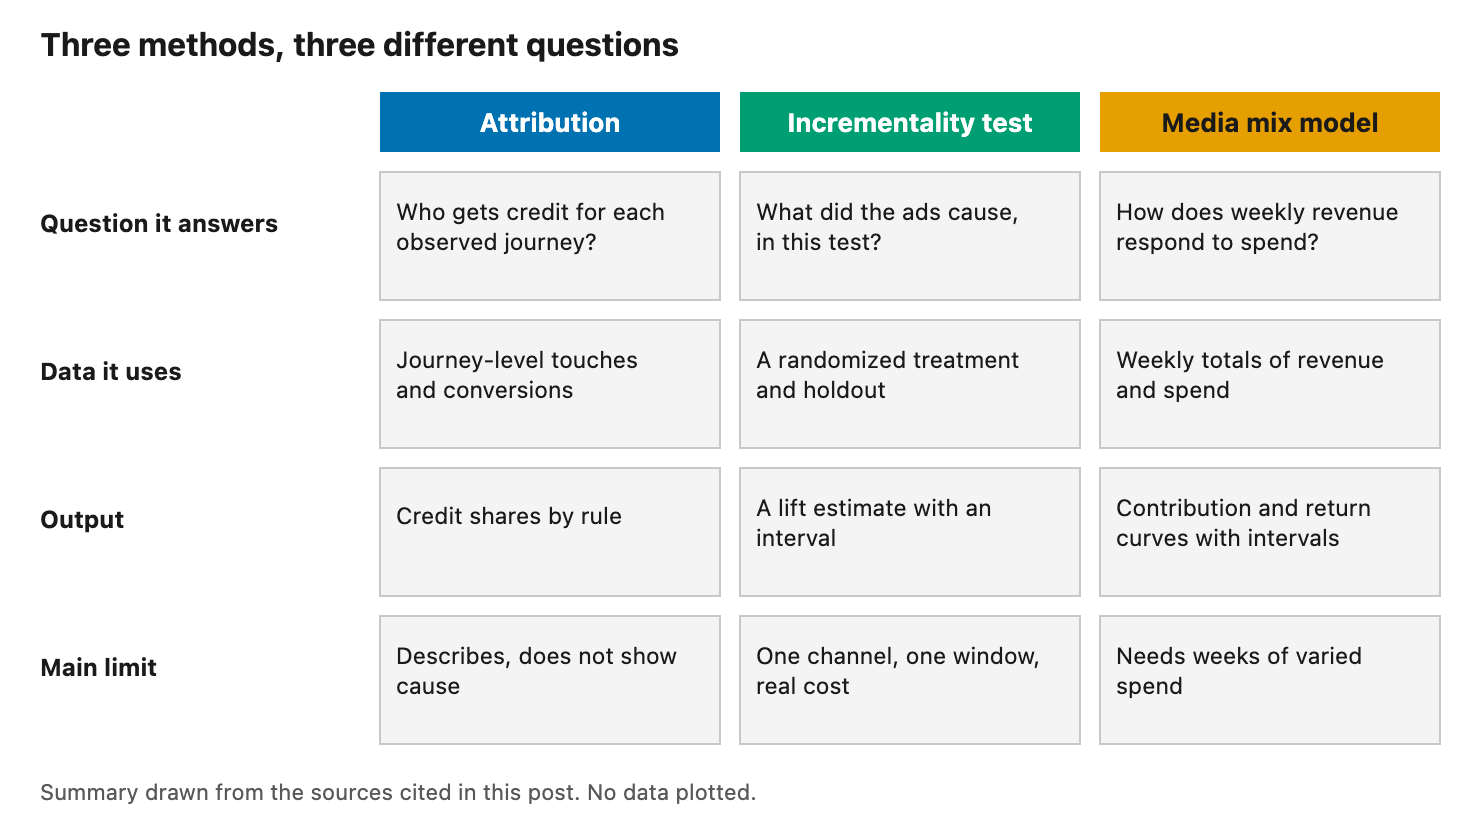
Three methods, three different questions. This is a summary of the sources cited on this page.
What can attribution tell you?
Attribution tells you how credit for observed conversions divides among the touches on their paths. It suits questions about journeys: which channels open them, which close them, and how a funnel stage is performing. Its rules are fixed and auditable, which makes them easy to explain and easy to check.
The common rules are last touch, first touch, linear, time decay, U-shaped and W-shaped. Each takes the same journey and divides one order differently. Attribution models compared: six rules, one journey walks through all six on a single synthetic order. It also covers how Adobe and HubSpot document them and which models Google Ads and Google Analytics 4 still offer. The W-shaped and U-shaped tutorial covers the milestone models and their edge cases.
Attribution is also where reporting starts for many teams. Platform reports usually follow one model, and matching that model lets you reconcile against the platform's numbers.
How much does the choice of rule matter?
It can matter a great deal. On a synthetic dataset of 730 journeys, I ran all six rules over identical conversions. Display's share of credit ranged from 2.5% under last touch to 33.3% under first touch. Paid search led under last touch, display under first touch, and email under four of the six rules. Illustrative numbers, not real customer data.
That spread is a range across counting rules, not an interval around a true value, and it says nothing about sampling noise or cause. Attribution model bias: why a channel's credit changes shows how to measure the spread for your own channels in five steps. It includes the code that generates the data.
What attribution cannot tell you
Attribution cannot tell you what would have happened without a channel. It divides credit among people who were exposed, and exposure is not random, so the credit inherits whatever selection put those people on your path. Answering the causal question takes a comparison against people who did not see the ads.
The strongest evidence comes from Facebook. In 2019, Gordon, Zettelmeyer, Bhargava and Chapsky compared observational methods with randomized experiments in 15 advertising studies that covered about 500 million user-experiment observations. They found that observational methods often fail to reproduce the experimental effects. Extensive demographic and behavioral controls did not fix the problem (Marketing Science).
That result concerns observational approaches in general, and attribution rules are one of them. It is a limit on what any rule applied to observed journeys can do. That limit explains why the causal question needs a different kind of evidence.
What an incrementality test adds
An incrementality test measures the conversions your ads caused by comparing people who saw them with a randomized group who did not. It answers the causal question for one channel, one window and one level of spend. Its weakness is noise and narrow scope, and its strength is that the comparison is fair.
Google frames its Conversion Lift tool this way, comparing a treatment group with a control group in user-based and geography-based versions (Google Ads Help). Geo experiments have a longer history. In 2011, Vaver and Koehler at Google described randomly assigning regions to control or treatment (Google Research).
In my synthetic example, attribution credited a campaign with 900 conversions. A randomized holdout of 100,000 people per group measured 150 incremental conversions, with a 95% interval of about 25 to 275. Both numbers were correct answers to different questions, and Incrementality vs attribution works through the example.
Tests are also noisy, because advertising effects are small relative to the variation in individual sales. Lewis and Rao found wide intervals on return across 25 large field experiments, and the incrementality post covers that evidence. A test is unbiased but may be imprecise, so plan its size in advance and report the interval.
What does a media mix model add?
A media mix model covers every channel and every week at once. It estimates how revenue responds to spend, including carryover and diminishing returns, and it reports contribution and marginal return with credible intervals. It does not need user-level data, but it does need enough weeks of data and enough variation in spend.
Marginal return is the return on the next dollar in a channel. It differs from average return, which describes what the channel did on the whole. Budget reallocation follows the marginal number, and a media mix model is the tool that estimates it, whereas credit tables do not.
What are the limits of a media mix model?
The approach has real limits. In 2017, Chan and Perry at Google described why media mix models struggle to answer advertisers' effectiveness questions consistently (Google Research). Robyn's guide adds that too much granularity without enough variation and volume can produce overspecification and noise.
Meridian's documentation says users can inject business knowledge through priors, so that the model reflects both domain expertise and data. That matters for trust, because a model that states its priors lets a reader see what the data said and what the analyst assumed.
The same logic applies to the output. Because an interval is part of every figure, a reader can see where the model is confident and where it is not. A wide interval is information about the data, not a defect to hide. The media mix modeling explainer covers the mechanics.
How do experiments and media mix models work together?
The strongest setup uses experiments to calibrate a media mix model. The model covers the whole mix, and the experiment supplies causal evidence for one slice that the model treats as a prior. Each covers the other's blind spot, which is why both open-source engines document the workflow.
Meridian's CalibrationBuilder translates incrementality experiment results into ROI priors, adjusting for differences in spend, recency and duration (Google for Developers). Robyn's guide strongly recommends using experimental and causal results to calibrate media mix models.
The adjustments matter because experiments and models differ in scope, timing and duration. A short test may miss long-lived effects, since advertising can keep working after spend stops. The remedy is to state the test's window beside its result. Let the model reconcile the two rather than treating either as final.
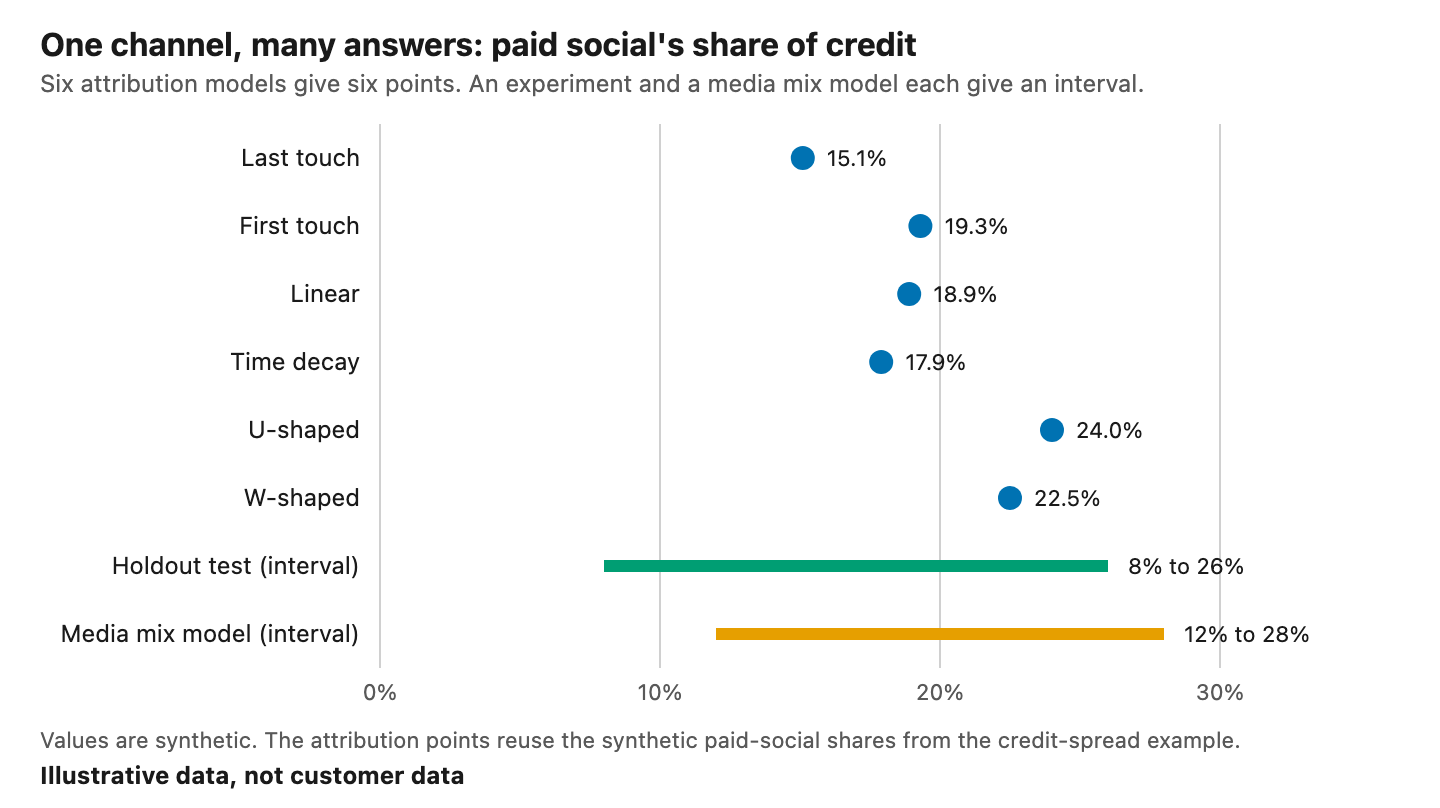
One channel, many answers. Six attribution models give six points, while a test and a model each give an interval.
Look at the picture as a whole. The six attribution points cluster between 15% and 24%, and the test and model intervals are wider and overlap the points. Overlap is reassuring, but the intervals are the honest statement of uncertainty and the points are not. That is the case for showing intervals.
The data each method needs
Each method asks for a different kind of data, and the requirement often decides what is practical today. Attribution needs linked journeys, a test needs randomization and enough people, and a media mix model needs weeks of revenue and spend with real variation. Knowing the requirement tells you where to start.
Attribution. You need touches and conversions, each with a timestamp, joined by a shared identifier. The lookback window decides which touches count, and a conversion with no touch inside it is unmatched, so it receives no credit under any model. Missing links reduce coverage, and the credit table then describes a subset of your revenue.
Incrementality tests. You need the ability to withhold ads from a random group or region, and a sample large enough to see the effect. Informative experiments can require very large samples, so size the test before you commit.
Media mix models. You need weekly revenue and spend by channel over enough weeks to separate media effects from seasonality. You also need variation, because a channel with flat spend gives the model nothing to learn from.
These requirements describe what each method can and cannot see. Where you lack one, the options are to collect more data, to choose a different method, or to accept a wider interval.
Which method should you use for which decision?
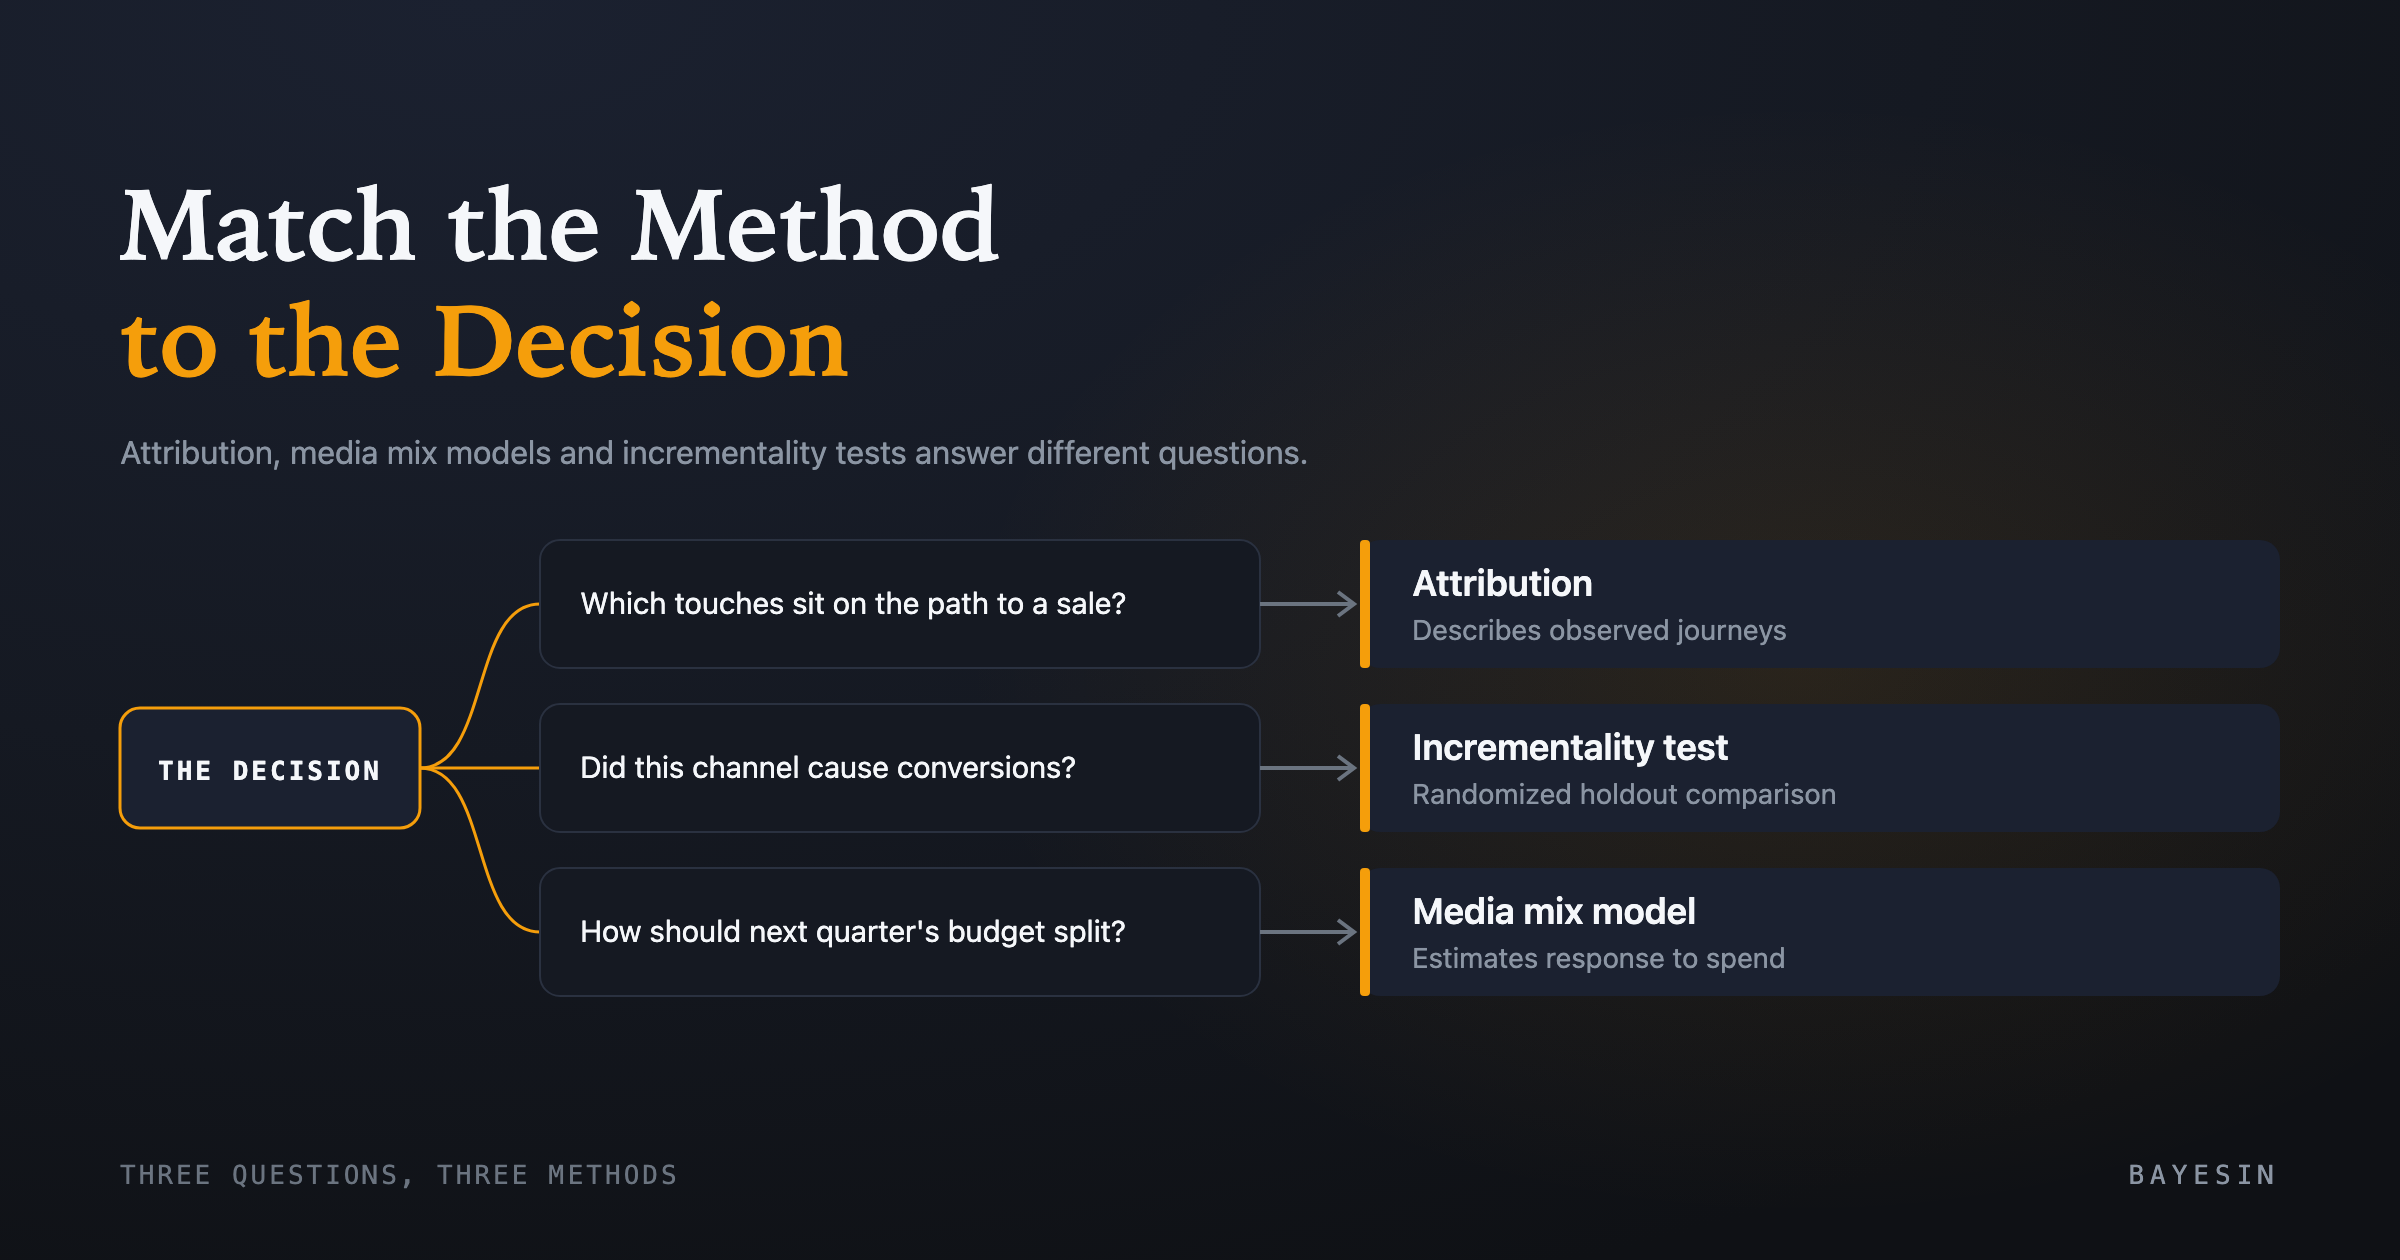
Match the method to the question. Use attribution to describe journeys and stage performance. Use a test to check whether a specific channel caused conversions, and a media mix model to split a budget across channels. Use the ledger as the control total for all of them.
- Which touches sit on the path to a conversion? — Start with...: Attribution; Why: It works on observed journeys and is auditable
- Did this channel cause conversions? — Start with...: An incrementality test; Why: A randomized comparison is the fair one
- How should next quarter's budget be split? — Start with...: A media mix model; Why: It estimates response to spend across channels
- Does my report match finance? — Start with...: Ledger reconciliation; Why: The ledger fixes the total
- How much did privacy changes limit my data? — Start with...: Coverage checks; Why: Unmatched conversions show the gap
No row is exclusive, and most decisions involve two methods. A budget change proposed by a model deserves a test on its riskiest channel. A test result deserves a place in the model so that it informs the whole mix.
How do you reconcile attribution to the ledger?
Build a bridge from the conversion value attribution used to the net revenue in the ledger. List known differences one at a time, such as refunds, tax and shipping, test orders and timing. Size what remains as unexplained, and compare it against a tolerance that you set in advance.
Dates differ by design. Stripe's documentation says each of its reports uses a different type of date (Stripe). Google Ads Help says conversions can be reported up to 90 days after the click, and the conversion window sets the limit (Google Ads Help).
Keep two gaps apart. The unexplained ledger difference is a data-quality question, and the unmatched conversion share is a coverage question. How to reconcile marketing attribution to revenue walks through a synthetic bridge from $540,000 of imported conversion value to $500,000 of ledger revenue.
How privacy changes affect measurement
Privacy changes reduce how much of your journey data can be linked, which lowers attribution coverage. They affect aggregated methods much less. Safari, Firefox and iOS apps have restricted tracking for years, and Chrome kept third-party cookies while Google retired its Attribution Reporting API in October 2025.
The key dates are March 2020 (WebKit blocks cross-site cookies), April 2021 (Apple's tracking prompt) and June 2022 (Firefox's Total Cookie Protection). Google's announcements of April and October 2025 shaped Chrome's course. The cookies post lists each date with its source.
Modeled conversions help fill gaps, although Google notes that it cannot observe whether an unconsented conversion had an ad interaction (Google Ads Help). Media mix models and geographic experiments run on aggregated data, so they survive by design. That post also sets out five checks you can run this quarter.
A sensible order of work
Add one step at a time, starting with the simplest and most certain. Reconcile to the ledger first, since every later step depends on trustworthy totals. Then fix a reference attribution model and publish the spread. Test your most sensitive channel, and fit a media mix model that you calibrate with the test.
- Reconcile. Bridge conversion value to ledger revenue and record the tolerance.
- Fix a reference model. Pick one attribution rule and report the range across the others beside it.
- Test one sensitive channel. Choose the channel whose credit swings most, and size the test up front.
- Fit a media mix model. Use weekly spend and revenue, and calibrate with the test result.
- Report intervals. Show ranges everywhere, and state the assumptions.
You need not do all five at once, because each step improves the one after it. If you already run some of them, treat the list as a way to see what would add the most next.
What should you ask of any measurement output?
Ask four things of any number, whatever produced it. What rule or prior produced it, and what is the interval? What data went in, and how much was missing? And what would change the answer? A method that cannot answer these is describing a result, not defending one.
This is the standard I hold my own work to. State the assumptions, show the range, and name the checks that would make you distrust the output. A model that admits when its data cannot support an answer is more useful than one that always produces a figure. It tells you when to lean on it and when to gather more evidence.
Frequently asked questions
Is media mix modeling better than attribution?
Neither is better in general, because they answer different questions. Attribution describes journeys you can observe, while a media mix model estimates how revenue responds to spend across channels. Choose by the decision at hand, and use both when a budget choice is at stake.
Can attribution replace incrementality testing?
No. Attribution divides credit among observed touches and has no control group. An incrementality test compares exposed people with a randomized holdout, so it can estimate what ads caused. Research comparing observational methods with experiments found that observational methods often fail to reproduce experimental effects.
Do I need user-level data for media mix modeling?
No. A media mix model runs on aggregated data such as weekly revenue and spend by channel. Meta's Robyn guide states that it does not need user-level data. It does need enough weeks of data and enough variation in spend to separate channels from each other.
How should experiments and media mix models work together?
Use experiments as causal evidence and the model as the wider frame. Convert a test's result into a prior for the model, adjusting for differences in spend, timing and duration. Meridian and Robyn both document calibrating models with experiments, and both stress stating the assumptions.
What does attribution look like after privacy changes?
Coverage falls where browsers and apps limit identifiers, so more conversions appear unmatched. Attribution still works on journeys you can link. Report the matched and unmatched shares, and lean on aggregated methods for the budget split. The dated details are in the cookies post.
Sources
- Meta, "Analyst's guide to MMM," Robyn documentation
- Google for Developers, "An introduction to Meridian"
- Google for Developers, "Set custom ROI priors using past experiments," Meridian documentation
- Adobe, "Attribution Components," Adobe Analytics documentation
- HubSpot Knowledge Base, "How to understand attribution report definitions in HubSpot's report builder"
- Google Analytics Help, "Get started with attribution"
- Google Ads Help, "About attribution models"
- Google Ads Help, "About Conversion Lift"
- Gordon, Zettelmeyer, Bhargava and Chapsky, "A Comparison of Approaches to Advertising Measurement: Evidence from Big Field Experiments at Facebook," Marketing Science 38(2)
- Lewis and Rao, "The Unfavorable Economics of Measuring the Returns to Advertising," Quarterly Journal of Economics 130(4) Vaver and Koehler, "Measuring Ad Effectiveness Using Geo Experiments," Google Research
- Chan and Perry, "Challenges and Opportunities in Media Mix Modeling," Google Research
- Stripe, "How to select a report," Stripe Documentation
- Google Ads Help, "Find out how long it takes for your customers to convert"
- WebKit Blog, "Full Third-Party Cookie Blocking and More"
- Apple Newsroom, iOS 14.5 release announcement
- Mozilla Blog, "Firefox rolls out Total Cookie Protection by default to all users worldwide"
- Google Privacy Sandbox blog, "Next steps for Privacy Sandbox and tracking protections in Chrome"
- Google Privacy Sandbox blog, "Update on plans for Privacy Sandbox technologies"
- Google Ads Help, "About consent mode modeling"
See it on your own rows.
Bayesin is pre-launch. Join the waitlist and we will reach out as access opens.
Get new posts by email.
New posts only. See privacy for what we keep.