Attribution vs MMM
Attribution model bias: why a channel's credit changes
Attribution model bias moved display credit from 2.5% to 33.3% across six rules on 730 synthetic journeys. Measure the spread for your channels in five steps.
Brandon Cade · Sep 23, 2026 · 7 min read
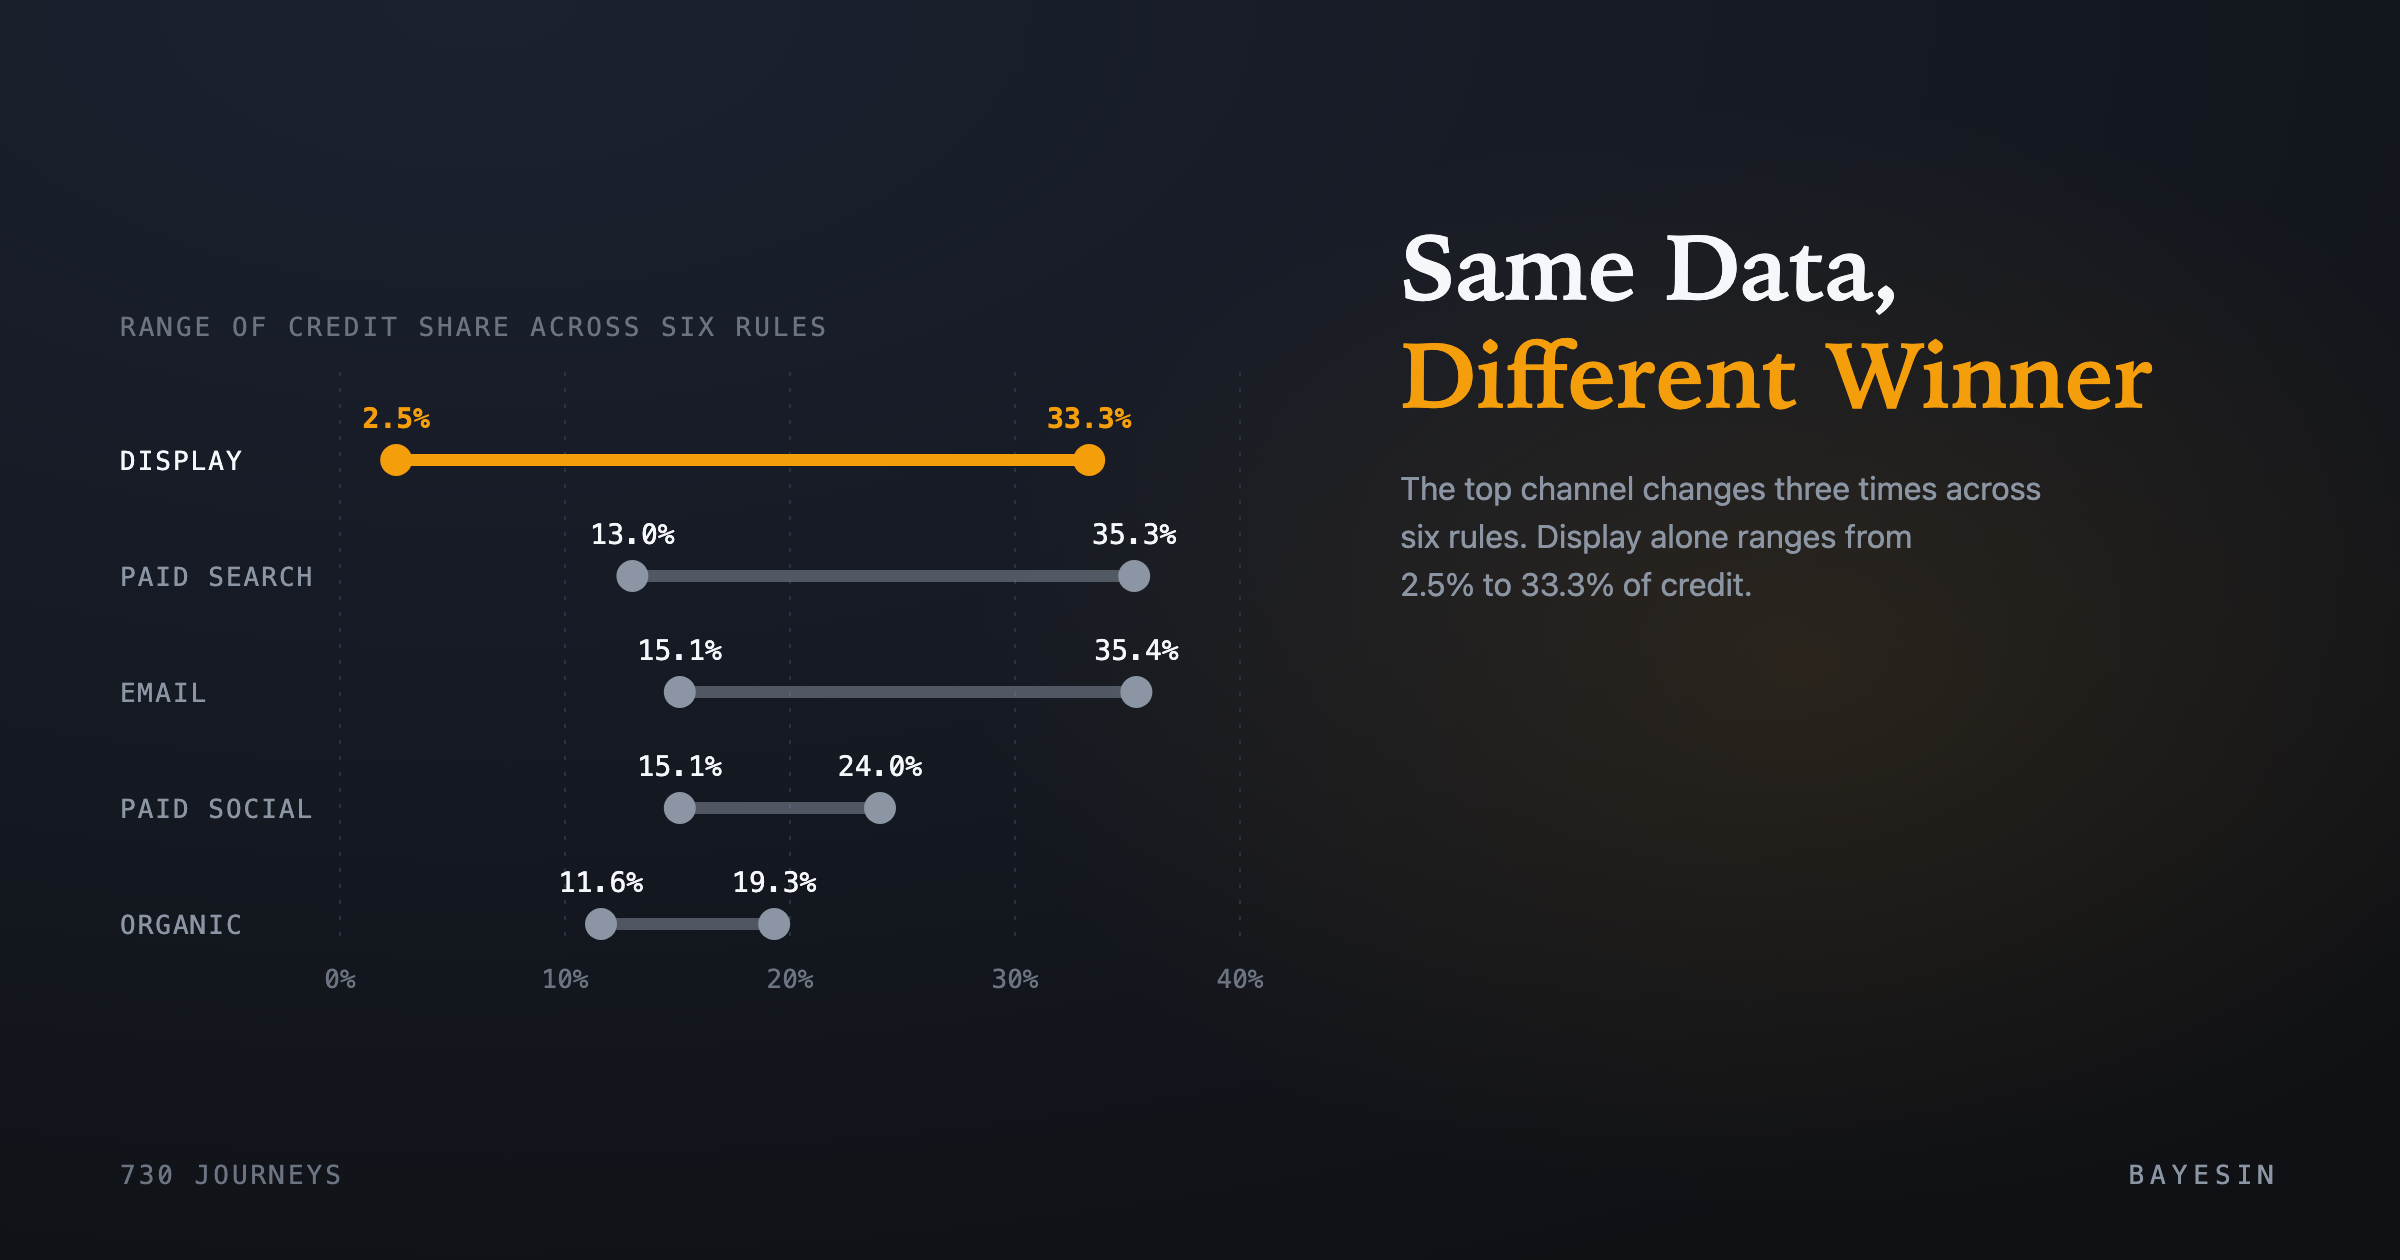
Ask which channel drives your revenue and the answer depends on the rule that divides the credit. That dependence is a property of rule-based attribution, and it is a form of attribution model bias in channel credit that you can measure.
Why does a channel's credit change with the model?
Each attribution rule encodes an assumption about which position in a journey deserves credit. Channels are not spread evenly across positions, because some tend to open journeys and others tend to close them. A rule that rewards openers therefore helps one set of channels, and a rule that rewards closers helps another.
Nothing about customer behavior changes between models, since the touches, the timestamps and the order values stay the same and only the weights move. If you are new to the six rules, Attribution models compared: six rules, one journey explains each on a single order. The pillar page places them beside experiments and media mix modeling.
What does the spread look like on 730 synthetic journeys?
On my synthetic data, one channel's credit ranged across 30.8 percentage points depending on the rule. The dataset holds 2,000 journeys of one to six touches across five channels: paid search, email, organic, paid social and display. Of those, 730 include a lead signup, so all six models apply to them, and the table below uses those 730 only. Illustrative numbers, not real customer data.
I built in one assumption on purpose: display is more likely early in a journey and paid search more likely late. U-shaped and W-shaped credit needs a milestone, so I compared all six models on the 730 journeys that have one. Time decay uses a 7-day half-life.
- Paid search — Last touch: 35.3%; First touch: 13.0%; Linear: 21.9%; Time decay: 27.2%; U-shaped: 13.0%; W-shaped: 17.4%
- Email — Last touch: 31.8%; First touch: 15.1%; Linear: 28.8%; Time decay: 31.4%; U-shaped: 35.0%; W-shaped: 35.4%
- Organic — Last touch: 15.3%; First touch: 19.3%; Linear: 14.4%; Time decay: 14.1%; U-shaped: 11.6%; W-shaped: 12.0%
- Paid social — Last touch: 15.1%; First touch: 19.3%; Linear: 18.9%; Time decay: 17.9%; U-shaped: 24.0%; W-shaped: 22.5%
- Display — Last touch: 2.5%; First touch: 33.3%; Linear: 16.0%; Time decay: 9.5%; U-shaped: 16.4%; W-shaped: 12.6%
Share of credited conversion value by channel and model, 730 synthetic journeys. Illustrative data, not customer data.
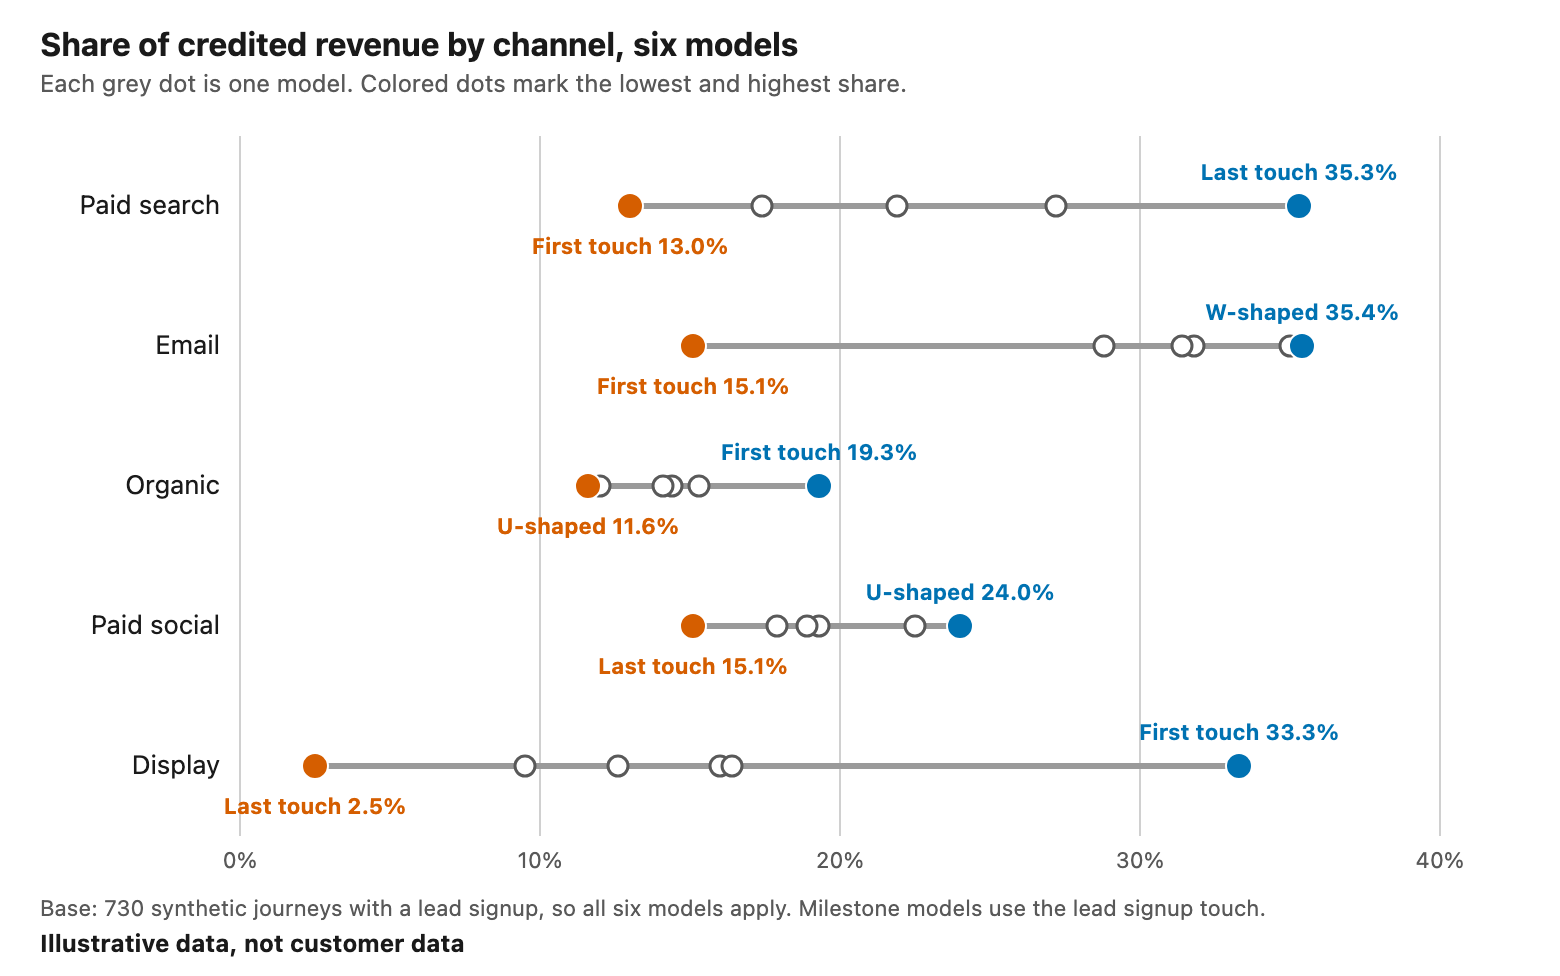
The same table as a dot plot.
Read the ranges. Display runs from 2.5% to 33.3%, paid search from 13.0% to 35.3%, and email from 15.1% to 35.4%. Organic and paid social move much less, by about 7.7 and 8.9 points. Paid search leads under last touch, display under first touch, and email under linear, time decay, U-shaped and W-shaped.
How was the synthetic data generated?
Each of the 2,000 journeys draws one to six touches on distinct days in the 30 days before purchase. Channel weights depend on position: display favors early touches, paid search favors late ones, email peaks mid-journey, and organic stays flat. If a journey has an email or paid social touch that is not first, that touch becomes the lead signup with probability 0.75. This rule produces the 730 journeys. The six credit rules then run on those journeys.
How do you measure a channel's spread?
Measuring spread takes five steps, and none needs new data. You pin the inputs and run every model on the same conversions. Then you compute each channel's range, label the channels, and check how much revenue the models could not place. The output is a table you can bring to a planning meeting.
Steps 1 and 2: pin the inputs and run every model
Choose one reporting period and one lookback window, then hold both fixed. A touch outside the lookback never enters the calculation, so changing the window changes every model at once. Record the currency and the conversion type too. Then run last touch, first touch, linear, time decay, U-shaped and W-shaped over the same conversions. If a model cannot apply to a journey, count those journeys separately. Leave them out of every model's comparison rather than quietly re-crediting them under a different rule.
Steps 3 and 4: compute each range and label the channel
For each channel, take the lowest and highest credit share across the models. The range is the difference in percentage points, so display has a range of 30.8 points in the table above and organic has 7.7. Then pick a threshold before you look at results, so the label is not chosen after the fact. Any cut-off is a judgment call, and mine is only an example. A channel whose credit moves by less than about ten points is stable in this dataset. Paid social and organic qualify, while display, paid search and email are sensitive.
Step 5: check coverage before you trust any table
Count the conversions that had no touch inside the lookback. These are unmatched: they appear in your conversion total but receive no credit under any model. If a large share of revenue is unmatched, the spread among the matched part understates your uncertainty. The ledger reconciliation post shows how to size that gap.
Reading attribution model bias in a wide spread
A wide spread means the channel's credit depends on the counting rule. It does not mean the channel is weak or strong. The spread is a range across rules, not an interval around a true value. It captures rule choice only and says nothing about sampling noise or cause.
Two habits help. First, ask where the channel usually sits in a journey. A channel that mostly opens journeys will look small under last touch and large under first touch, whatever it contributes. Second, look at the ranking as well as the size. If the top channel changes with the rule, a budget argument built on one ranking rests on a rule choice.
What should you do about a sensitive channel?
Bring in evidence that does not depend on the credit rule. Credit rules divide observed touches, so they cannot show what a channel adds, whereas experiments and media mix models can. Use the spread to decide where that extra evidence is worth the effort.
The research on why is summarized in the pillar page, which covers the field experiments of Gordon and colleagues. Rule-based credit is not identical to the methods they tested, but it is observational too. Experiments have difficulties of their own, and the incrementality post explains why a test is one input among several.
Media mix models face limits as well. In 2017, Chan and Perry at Google described why they struggle to give valid answers consistently (Google Research). That is why calibrating a model with tests is the usual recommendation.
Choosing a reference model
Choose the reference model by the decision it supports, then report the spread beside it every time. Last touch is easiest to reconcile with platform reports, and linear is a neutral middle. U-shaped or W-shaped suits pipelines with a named stage, and the W-shaped tutorial shows how to calculate both by hand. Whatever you pick, publish the range so that nobody mistakes one rule for a fact.
Adobe and HubSpot both document these rules with exact weights, which makes the choice auditable (Adobe, HubSpot). Built-in model sets also change over time. The six-models post lists which rules Google Ads and Google Analytics 4 still offer.
Frequently asked questions
Is one attribution model less biased than the others?
Each rule is biased toward a position. First touch favors openers, last touch favors closers, and linear favors channels that appear often. None is neutral about causal contribution, so the practical fix is to report a range across rules and bring in experimental or aggregate-response evidence.
How wide a spread is too wide?
There is no universal cut-off. Choose a threshold before looking, based on the size of the budget decision. In this synthetic example I used about ten percentage points as an illustrative line. Any channel beyond it is one where extra evidence is most valuable.
Do I have to use all six models?
No. Two or three that bracket the range, such as last touch, first touch and one anchor-based model, can show the spread. Use more when a decision is close or a channel is sensitive. The aim is to compare rules on identical inputs, not to add complexity.
Does a wide spread mean my attribution is wrong?
No. The models are doing what their rules say. A wide spread tells you the credit depends on the counting rule, so the number is a description and not a measurement of effect. Treat the range as the honest answer to "how much credit?"
Sources
- Adobe, "Attribution Components," Adobe Analytics documentation
- HubSpot Knowledge Base, "How to understand attribution report definitions in HubSpot's report builder"
- Gordon, Zettelmeyer, Bhargava and Chapsky, "A Comparison of Approaches to Advertising Measurement: Evidence from Big Field Experiments at Facebook," Marketing Science 38(2)
- Chan and Perry, "Challenges and Opportunities in Media Mix Modeling," Google Research
See it on your own rows.
Bayesin is pre-launch. Join the waitlist and we will reach out as access opens.
Get new posts by email.
New posts only. See privacy for what we keep.