Attribution vs MMM
How to reconcile marketing attribution to revenue
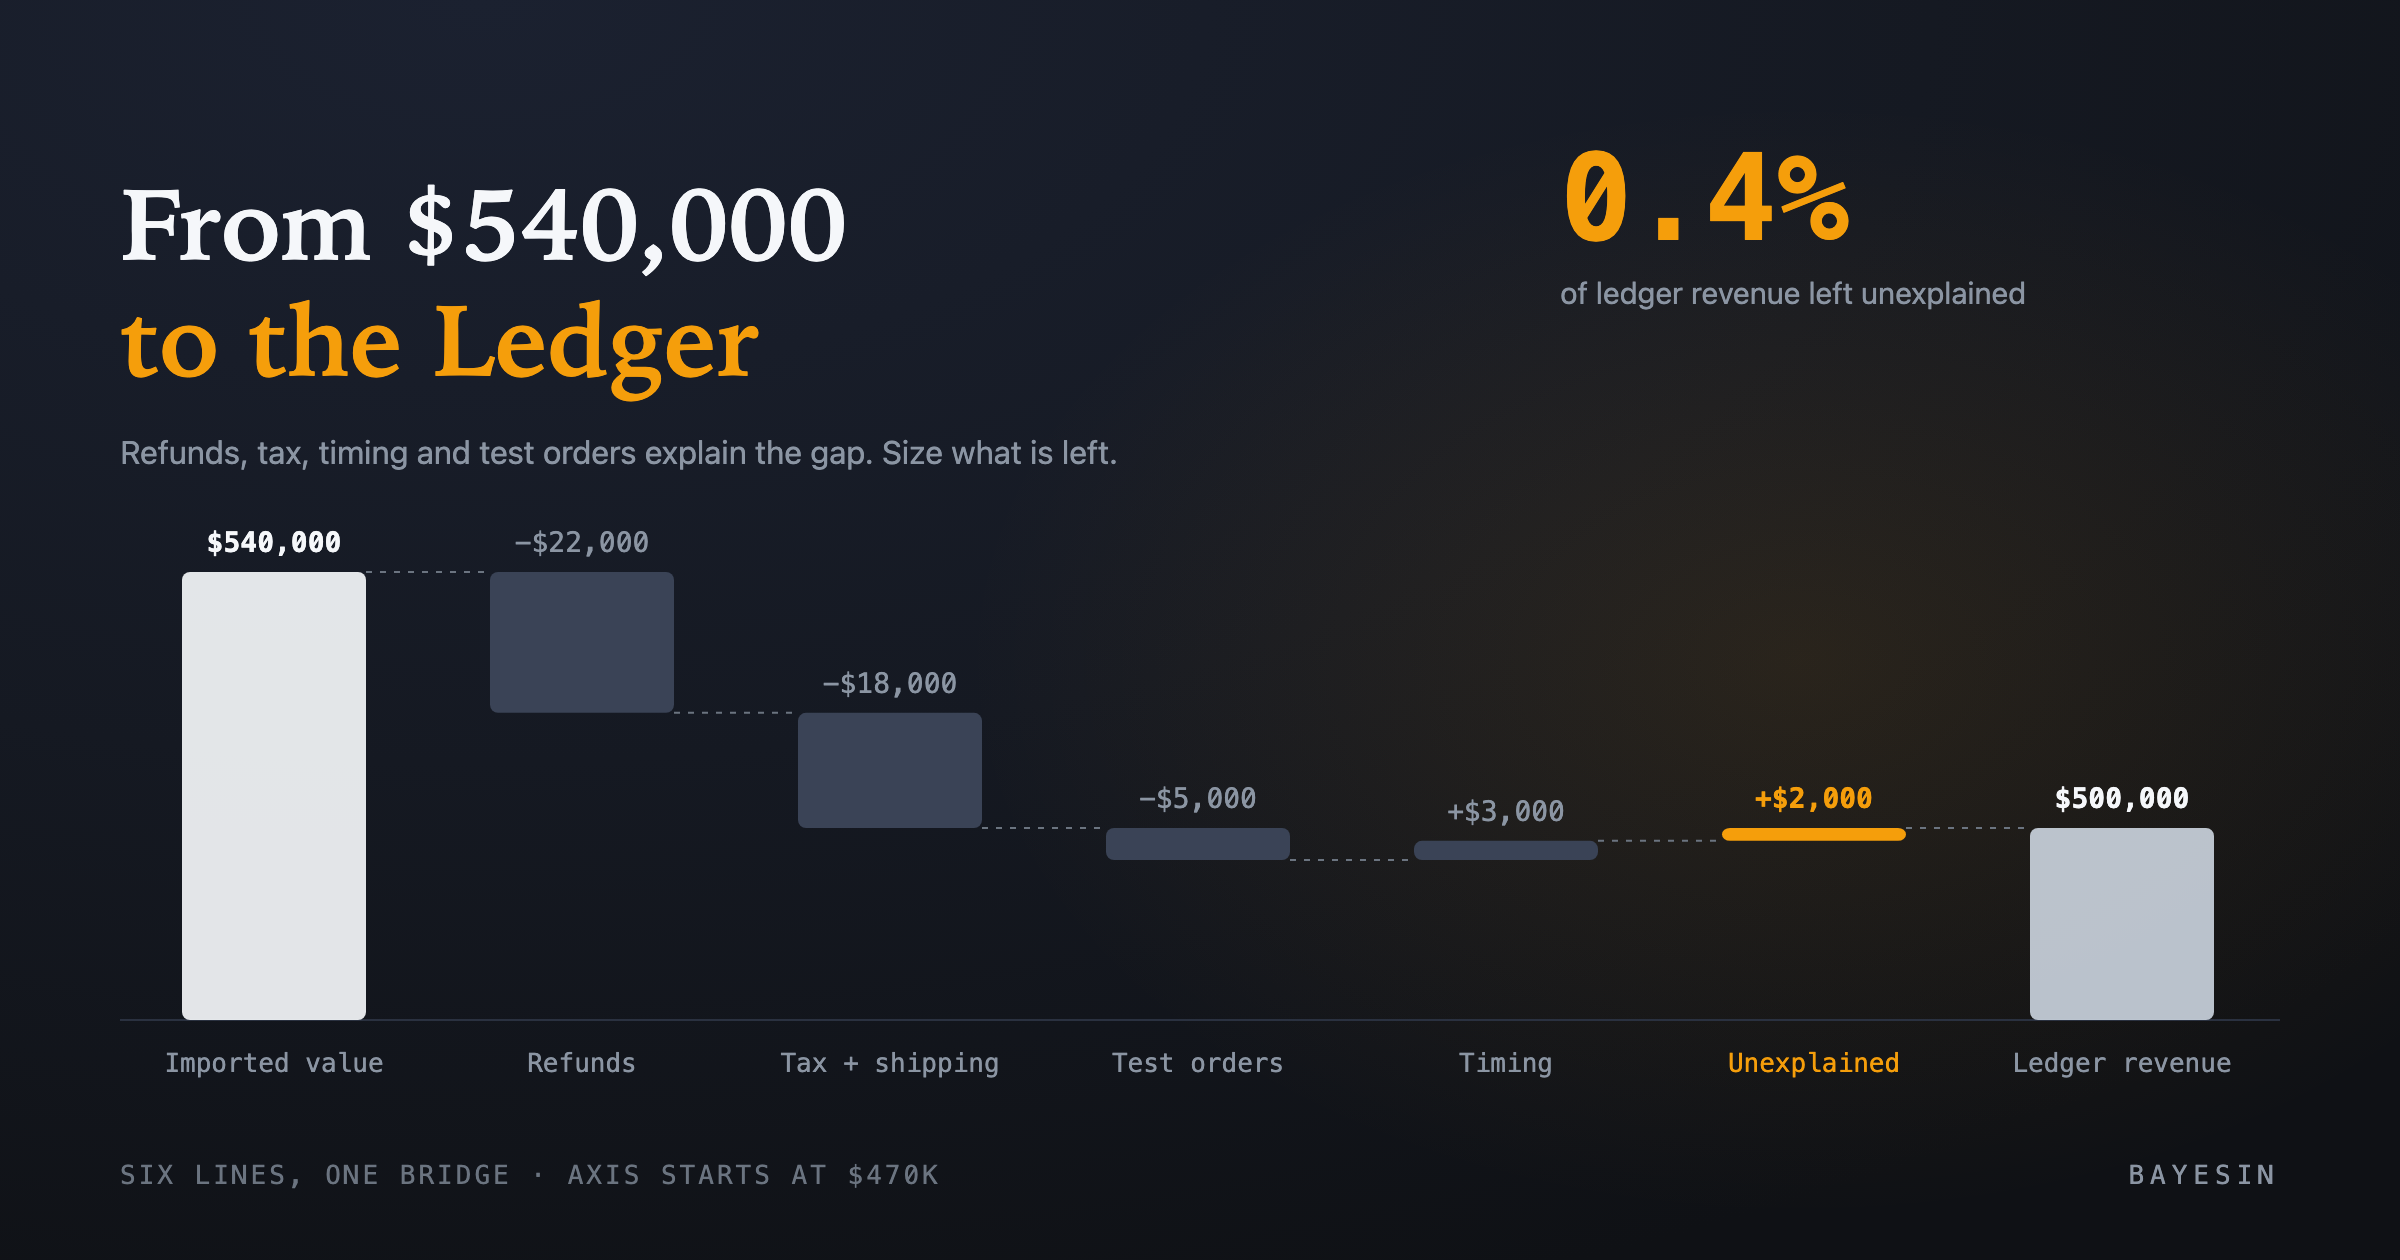
Reconcile marketing attribution to revenue in five steps. A synthetic $540,000 conversion total bridges to $500,000 of ledger revenue, 0.4% left unexplained.
Brandon Cade · Sep 20, 2026 · 7 min read
Key Takeaways
- Attribution reports and the ledger measure different things on different dates, so a gap between them is expected. The job is to explain it.
- Build a bridge in five steps: agree the scope, compare totals, list known adjustments, size the unexplained remainder, and check attribution coverage.
- Keep two gaps apart. The unexplained ledger difference is a data-quality question. The unmatched conversion share is a journey-coverage question.
- Set your tolerance before you look at the results, and write down every assumption in the bridge.
Marketing reports that a campaign drove $540,000 in orders, and finance reports that the month closed at $500,000. Both numbers can be correct, because each follows a different definition of revenue. To reconcile marketing attribution to revenue, you place those definitions side by side and account for the difference line by line.
Why do attribution and the ledger disagree?
Attribution and the ledger disagree because they answer different questions on different dates. Attribution counts conversions and their order values as reported by a tracking source. The ledger records net revenue as accounting recognizes it, so refunds, taxes, timing and test orders all sit between the two.
Expect a difference before you look for an error, since the two sources start from different systems. One system is built to follow journeys and the other to close the books. The work is therefore to translate between them rather than to pick a winner.
Prefer the short version first? Read why your ad platform and your bank balance tell different stories for the plain-English outline. The pillar page shows where reconciliation sits among attribution, experiments and media mix modeling.
How to reconcile marketing attribution to revenue in five steps
A bridge starts from the number attribution used and ends at the ledger, with each known difference listed on the way. It works in five steps: define the scope, compare the totals, list the adjustments, size what is left, and check attribution coverage. Everything below uses illustrative numbers, not real customer data, for a month with $540,000 of imported conversion value and $500,000 of ledger net revenue.
Steps 1 and 2: agree the scope and compare the totals
Choose one period, one currency and one definition of revenue before you compare anything. Attribution may hold order value including tax and shipping, while the ledger holds net revenue after refunds. Decide which side you will translate, and write the definitions where both teams can see them. If you sell in several currencies, reconcile each on its own, because a blended total can hide an offsetting error.
Then write both totals down and compute the gap in dollars and as a percentage of the ledger. Here the gap is $40,000, or 8% of $500,000. Do not explain anything yet, because the purpose is to learn the size of the problem before you search for causes.
Step 3: list the known adjustments
Work through the differences you can name, one at a time, and size each from source records. In this synthetic month, refunds and returns take out $22,000, tax and shipping take out $18,000, and test and cancelled orders take out $5,000. Timing adds back $3,000, from orders placed last period and recorded this one.
Timing deserves special care because dates differ by design. Stripe's documentation says each report it offers uses a different type of date to decide which transactions fall inside the period. The Balance report uses the date of change in the balance, and the payout reconciliation report uses the date the payout is available (Stripe). If two reports from one payment provider disagree on dates, an ad report and a ledger certainly can.
Step 4: size the unexplained remainder
After the adjustments, the bridge lands at $498,000 against a ledger of $500,000. The $2,000 difference, or 0.4% of the ledger, is unexplained. That is a normal outcome, so record it and compare it against a tolerance that you set in advance.
- Imported conversion value — Amount: $540,000; Running total: $540,000
- Refunds and returns — Amount: -$22,000; Running total: $518,000
- Tax and shipping — Amount: -$18,000; Running total: $500,000
- Test and cancelled orders — Amount: -$5,000; Running total: $495,000
- Timing (last period's orders recorded this period) — Amount: +$3,000; Running total: $498,000
- Unexplained remainder — Amount: +$2,000; Running total: $500,000
- Ledger net revenue — Amount: ; Running total: $500,000
Synthetic bridge from imported conversion value to ledger revenue. Illustrative data, not customer data.
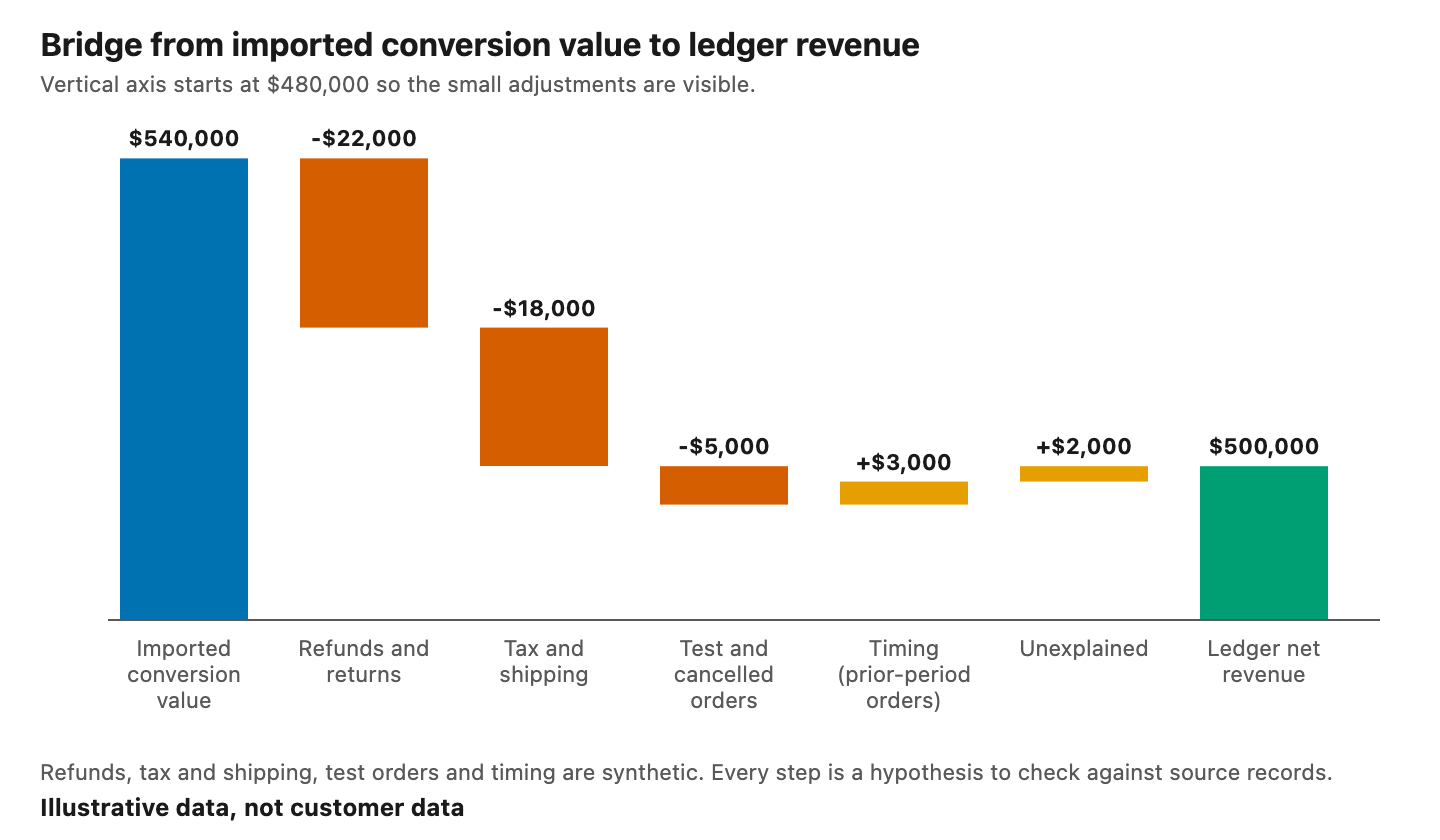
The same bridge as a waterfall chart.
Choose the tolerance before you see the remainder, so that it does not drift to fit the result. A finance partner will have a view on what counts as material. If the remainder exceeds that threshold, return to Step 3 and look for another adjustment.
Step 5: check attribution coverage
Coverage is a separate question, because it asks how much conversion value attribution could connect to any touch. A conversion is unmatched when no touch falls inside its lookback window. It receives no credit under any model, so the credit table cannot explain it. In this example, $405,000 of the $540,000 had at least one touch in its lookback, which is 75%, and the other $135,000 is unmatched.
Do not mix this gap with the ledger gap. The unexplained $2,000 says the totals do not tie perfectly, while the unmatched $135,000 says a quarter of the value has no journey behind it. A high match rate with a large ledger gap often points to a data problem. A low match rate with a small ledger gap often points to a tracking or identity limit.
Platform numbers differ from both
Ad platforms count conversions under their own rules and windows, so their totals differ from analytics tools and from the ledger. Each platform credits itself for the conversions it can see. Reconcile each platform to your journey data first, and then reconcile the journey total to the ledger.
Windows matter more than most people expect. Google Ads Help notes that conversions can be reported up to 90 days after the click, depending on your conversion window. It advises checking reports with a date range ending at least 30 days ago (Google Ads Help). A recent period will look incomplete for that reason alone.
View-through conversions add another difference. Google defines the view-through window as the period after an impression during which a view-through conversion is recorded. Extending the window usually increases the total (Google Ads Help). Changing a window changes the count without any change in customer behavior.
The models differ too, since Google Ads now offers only last click and data-driven attribution, as the six-models post explains. Two tools that use different models will report different credit for the same order. The credit-spread post shows how large that difference can be.
What can the ledger not tell you?
The ledger tells you how much revenue there was. It does not tell you which channel produced that revenue, and it cannot say what would have happened without your marketing. It fixes the total but not the split, which makes it the right control total and a poor measure of effect.
Use it that way. If your attribution credits sum to more than the ledger allows, something is double counting, and if they sum to much less, coverage is low. For the question of cause, an experiment or a media mix model is the better tool, and the incrementality post explains why.
Privacy limits also play a role in coverage. Google states that it cannot observe whether an unconsented conversion had an ad interaction, which is why it offers consent mode modeling (Google Ads Help). The cookie post covers what changed and when.
Frequently asked questions
Should attribution revenue match the ledger exactly?
No. Attribution counts conversion value as tracked, and the ledger records net revenue as recognized. Refunds, tax, shipping, timing and test orders sit between them. Aim to explain the gap within a tolerance that finance agrees, not to force the two totals to match.
What is an acceptable reconciliation gap?
There is no universal figure. Choose a tolerance with your finance partner before you look at results, based on what is material to the budget decision. Then record the unexplained remainder every period, so that a rising trend appears before it becomes a problem.
What are unmatched conversions?
Unmatched conversions are conversions with no touch inside the lookback window. They still appear in your conversion total, but they receive no credit under any model. A large unmatched share means your journey data explains only part of your revenue, so the credit tables describe a subset.
Why do platform-reported conversions exceed my orders?
Each platform counts conversions under its own rules, windows and dates, and several platforms can each claim the same order. Google Ads, for example, can report conversions up to 90 days after a click depending on your window. Reconcile each platform to journey data first, then to the ledger.
Sources
See it on your own rows.
Bayesin is pre-launch. Join the waitlist and we will reach out as access opens.
Get new posts by email.
New posts only. See privacy for what we keep.