Trusting a model
MMM baseline share too high or too low: what it means
Is your MMM baseline share too high or too low? A 99% media share means a 1% baseline. Five checks for a suspicious split, with published ranges of 20% to 85%.
Brandon Cade · Oct 1, 2026 · 7 min read
Key Takeaways
- Baseline share is the part of revenue a model does not credit to media, and a very small baseline share is a warning rather than a win.
- One vendor's QA guidance treats roughly 40 to 70 percent as typical for established brands and flags results below 20 or above 85 percent.
- The most common cause of an extreme split is spend that never drops or varies, which leaves the model nothing to compare against.
- You can test a split yourself by asking what quiet weeks looked like, then checking how wide the interval is.
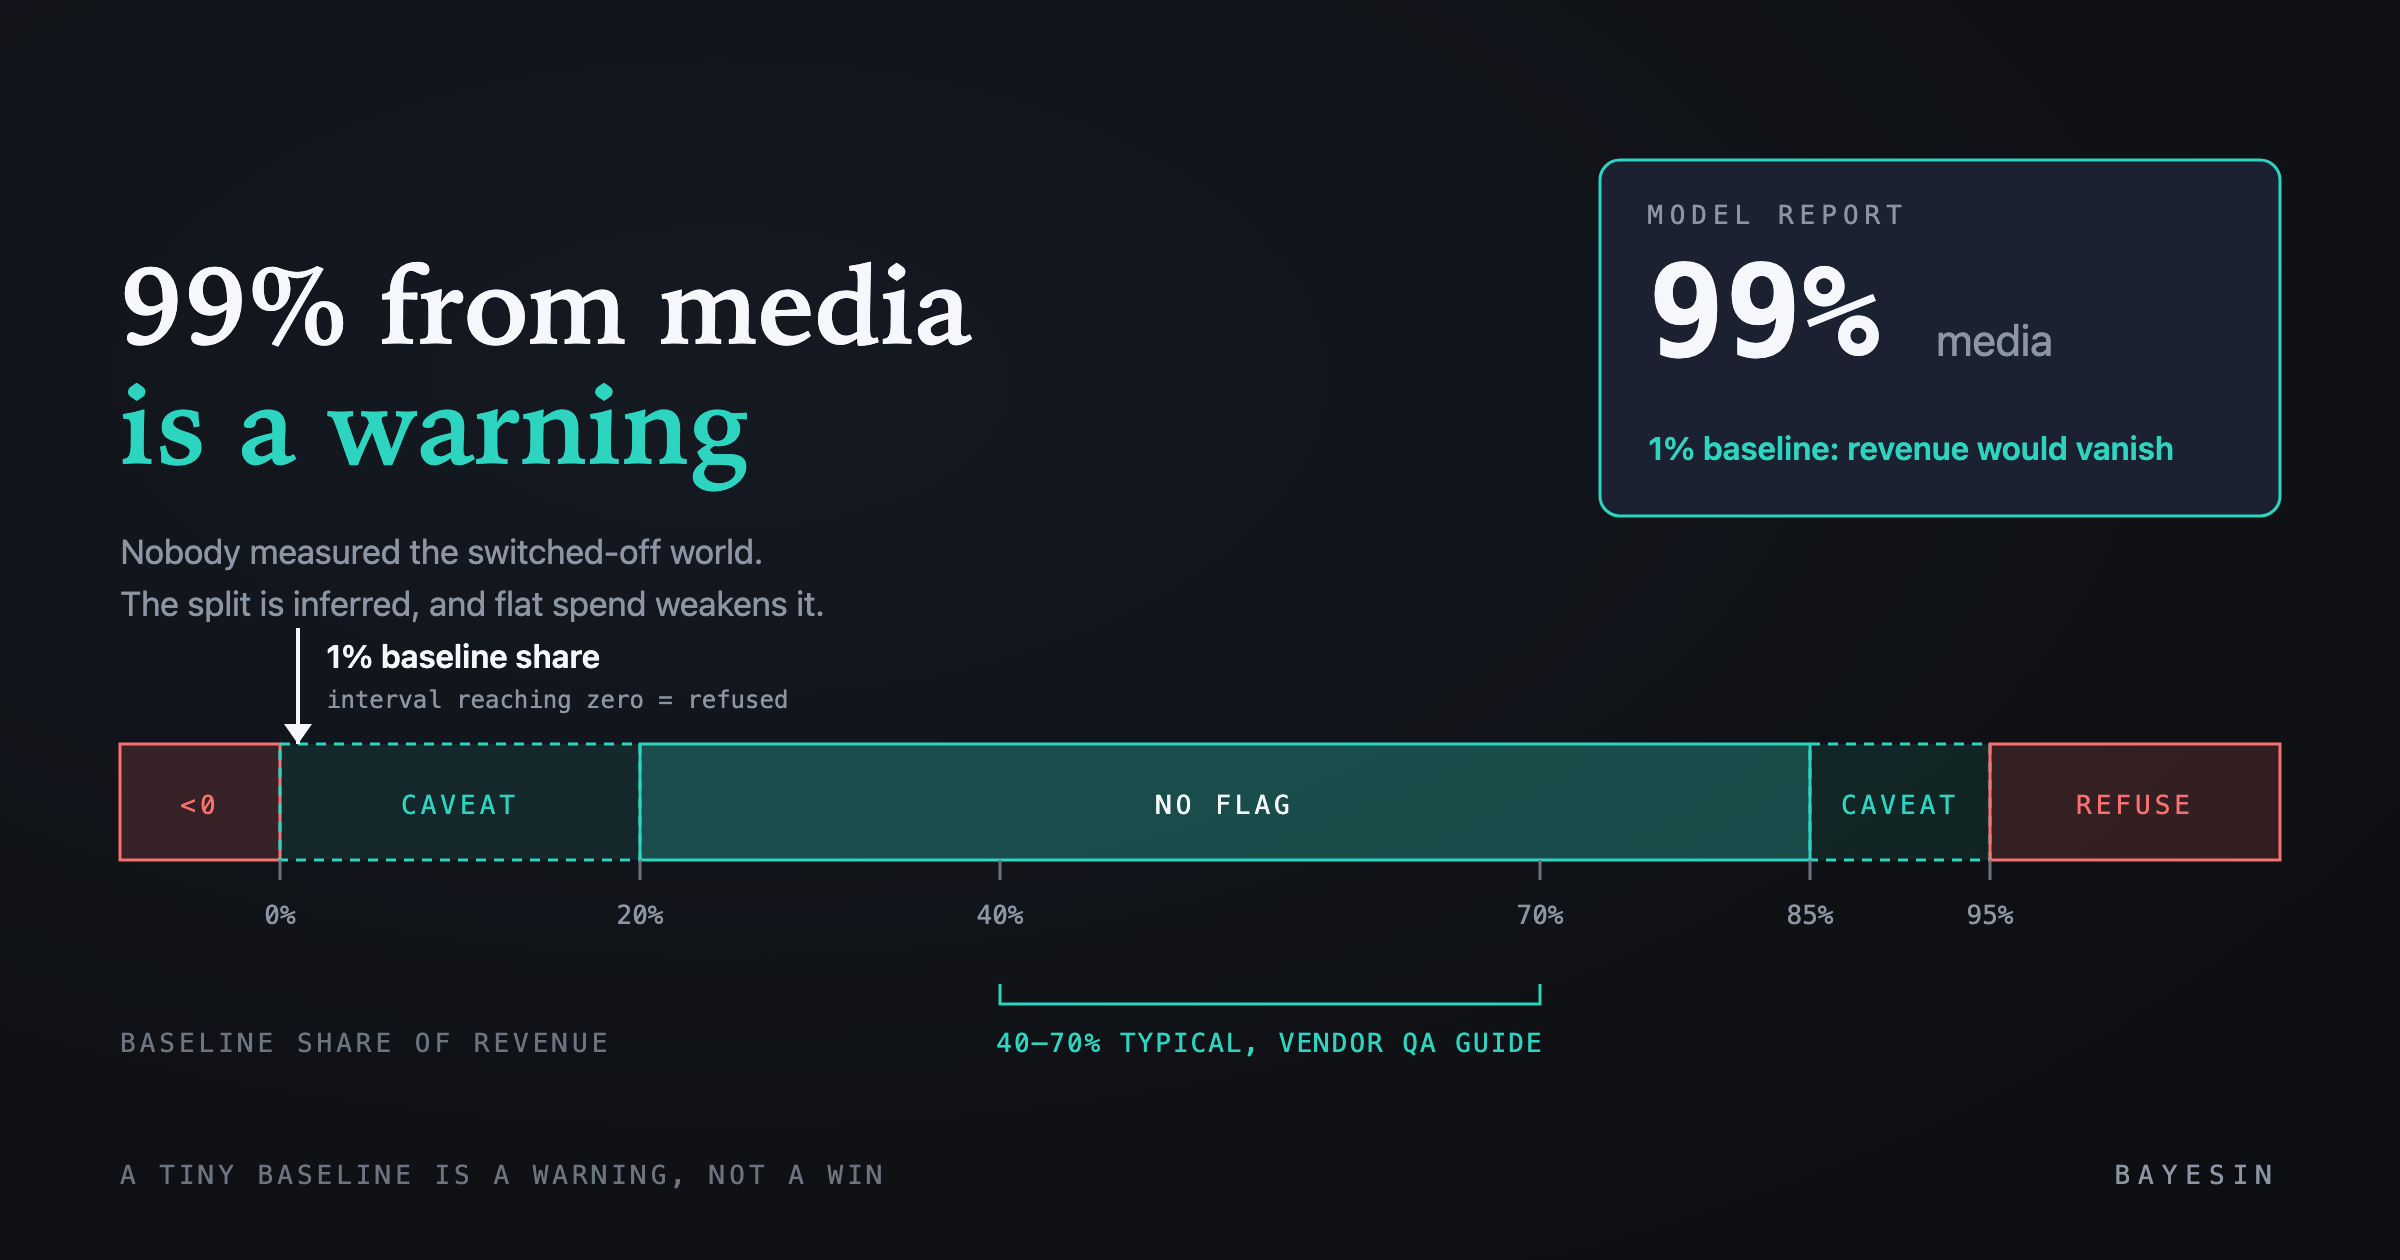
A model report says media drove 99% of your revenue, which reads like the best possible result for a marketing budget. I think it is one of the clearest signs of a baseline share that is too low, and it deserves a second look. This guide explains why, gives five checks for any split, and shows how the platform treats each range. Start with the guide to validating a marketing mix model if you want the whole picture.
What baseline share is, and why 99% from media is a warning
Baseline share is the portion of revenue a model does not credit to your measured media. It covers repeat customers, direct and branded demand, referrals, price and distribution. If media receives 99%, the baseline is 1%, which implies that revenue would nearly vanish if you stopped marketing, a claim few businesses would endorse.
The number is also a computed result rather than an observation. Nobody measured what revenue would be with every channel switched off, so the model inferred it from how revenue moved alongside spend. When spend never moved much, the inference is weak, and the split can land almost anywhere.
MMM baseline share too high or too low: five checks
Five short checks show whether a baseline split deserves trust, and you can work through them in order. Each takes a few minutes and needs only your own weekly data and the model's report, with no statistics beyond reading a range.
- 1. Say it out loud — Question: What does the split imply if every channel went dark?; Sign of trouble: An implication the business would reject
- 2. Quiet weeks — Question: What did revenue do in the lowest-spend weeks?; Sign of trouble: Revenue stayed near normal while the fit says it should collapse
- 3. Interval — Question: How wide is the range on baseline share?; Sign of trouble: A range that reaches zero
- 4. Spend variation — Question: Did any channel drop to near zero or swing widely?; Sign of trouble: Every channel roughly constant
- 5. Reference ranges — Question: Where does the split sit against published rules of thumb?; Sign of trouble: Below 20% or above 85%
Step 1: Say the implication out loud
Convert the split into a plain statement. If baseline share is 1%, the statement is that revenue would fall by about 99% if every channel went dark for a quarter. Read it to someone who knows the business, since their reaction tells you whether the split is measuring what you hoped.
The platform opens its caveat with exactly this framing, in a headline saying the outcome would collapse to almost nothing if you stopped marketing. It then asks you to treat per-channel figures as unreliable until you agree.
Step 2: Look at your quietest weeks
Find the weeks with the lowest total spend and ask what revenue did. If revenue stayed near its usual level, a baseline of 1% cannot be right. If revenue truly dropped by nearly everything, the split may be fine, but the numbers below are synthetic and illustrative, not customer data.
- Average weekly revenue — 1,000 units
- Average revenue in the 8 lowest-spend weeks — 930 units
- Baseline share implied by the fit — 1% (10 units)
- Baseline implied by the quiet weeks — roughly 93% (930 units)
The gap between 10 and 930 is the signal, because the quiet weeks say that most revenue arrives without heavy spend, while the fit disagrees. One of them is wrong, and I would trust the observed weeks first, because they are data rather than inference.
Step 3: Read the interval on the baseline
A baseline share should carry a credible interval, which is a range holding most of the probability. If that range runs from below zero to a small positive number, the data does not know the answer. Zero is a boundary, because revenue without marketing cannot be negative.
Google's Meridian health checks treat a consistently negative baseline as a clear problem. They grade the probability of a negative baseline, and a high probability counts as a statistical error.
Step 4: Check whether spend ever varied
Open the weekly spend for each channel and ask whether any channel dropped to near zero or swung widely. A channel held roughly constant cannot be separated from the baseline, and I go deeper in why a channel with constant spend cannot be measured.
Step 5: Compare with reference ranges
Compare the split with published rules of thumb, remembering that they are guides rather than proofs, as the next section explains.
The ranges practitioners treat as normal
Measured's QA guide gives a typical baseline of 40 to 70 percent for established brands and flags anything below 20 or above 85 percent. It is a vendor page, dated March 2026, and I cite it for what it says rather than as independent research. Those bounds question a result without proving it wrong, since a young or acquisition-heavy business can sit outside them for good reasons.
I could not find an independent, primary source that publishes comparable bounds, so the 20% and 85% marks rest on this one practitioner reference. Treat them as a starting point for judgment. The Measured page is also where the platform's 20% and 85% thresholds come from.
What Bayesin does with each range
The platform refuses some splits, warns on others, and lets the rest through, using bounds of 0%, 20%, 85% and 95% of baseline share. The figure shows where each range lands.
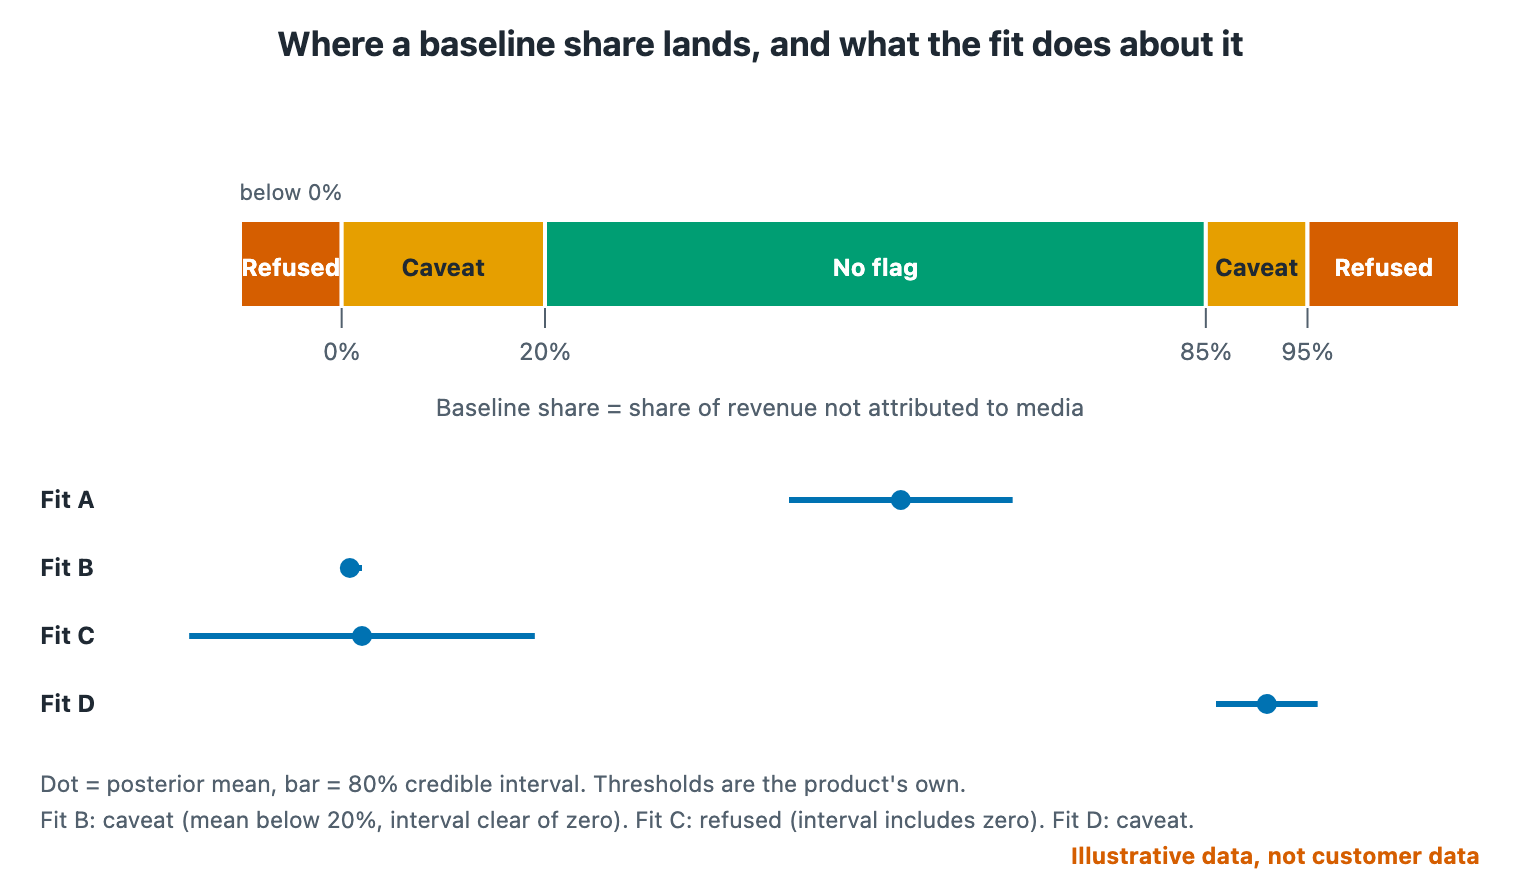
Figure 1. Baseline share zones as the platform applies them.
- Below 0%. Media contribution exceeds revenue, so the split does not close, and the fit is refused.
- Interval reaches zero. The 10th to 90th percentile range includes zero, or over 5% of the posterior is negative. The fit is refused, since the data does not answer the question.
- 0% to 20%, interval clear of zero. The fit publishes with a caveat, because the model measured something unusual.
- 20% to 85%. No flag.
- 85% to 95%. The fit publishes with a caveat, because the channels may rise and fall together too closely to separate.
- Above 95%. Media gets almost nothing, and the fit is refused.
A refusal suits a fit that did not measure its target, and a warning suits one that measured something surprising. When to distrust marketing mix model results lays out that logic in full.
Why spend that never drops causes extreme splits
A model learns a channel's effect by comparing weeks with more spend against weeks with less. If spend is always high, no low weeks exist to compare against. The model then cannot distinguish media's contribution from the steady baseline and may divide them arbitrarily.
Meridian's debugging page adds that when the data holds little information, the posterior resembles the prior. Extreme splits therefore often trace to thin information rather than to a real effect. The constant-spend case has its own guide, linked in Step 4.
What to do about an extreme split
Do not act on the per-channel figures until you have added information, which can mean more weeks, independent budget changes or an experiment. Each option gives the model a contrast it lacked, and each is something a team can plan for.
If one channel drives your split, a short holdout test on that channel is often the fastest way to resolve it. The constant-spend post covers how experiments and mix models fit together.
Also check your data for credits, refunds or negative spend rows, which can invert the arithmetic and produce a split that exceeds revenue. The platform names them as a cause when marketing appears to remove revenue overall.
Short answers on baseline share
Can media really drive 99% of a business's revenue?
It is very unlikely for an established business, since most revenue includes repeat purchases, direct visits and referrals that arrive without current media. A fit that reports 99% more often signals weak identification than a real effect. I would examine spend variation and the interval before accepting it.
Is a high baseline share, such as 90%, also a problem?
Not necessarily. It may mean media truly drives little revenue, or that channels move together too closely to separate. Published guidance flags results above 85 percent for review, and varying budgets independently across weeks is what distinguishes the two explanations.
Does a baseline inside the 40 to 70 percent range prove the model is right?
No. It means only that one common sanity check passed. A model can land in range and still be wrong for other reasons, such as unsettled sampling or too little history. Treat range checks as one layer, alongside convergence, interval width and an accuracy check on held-back weeks.
What is the fastest way to test a suspicious split?
Compare it with your lowest-spend weeks. If revenue stayed close to normal in those weeks, a tiny baseline cannot be right, and the check takes minutes without any statistics. Then examine the width of the baseline interval and whether any single channel varied across the period.
Sources
See it on your own rows.
Bayesin is pre-launch. Join the waitlist and we will reach out as access opens.
Get new posts by email.
New posts only. See privacy for what we keep.