Trusting a model
How to validate a marketing mix model: six checks
How to validate a marketing mix model in six checks on data, fit and interpretation, with published thresholds such as R-hat below 1.01 and 104 weeks of data.
Brandon Cade · Sep 30, 2026 · 14 min read
Key Takeaways
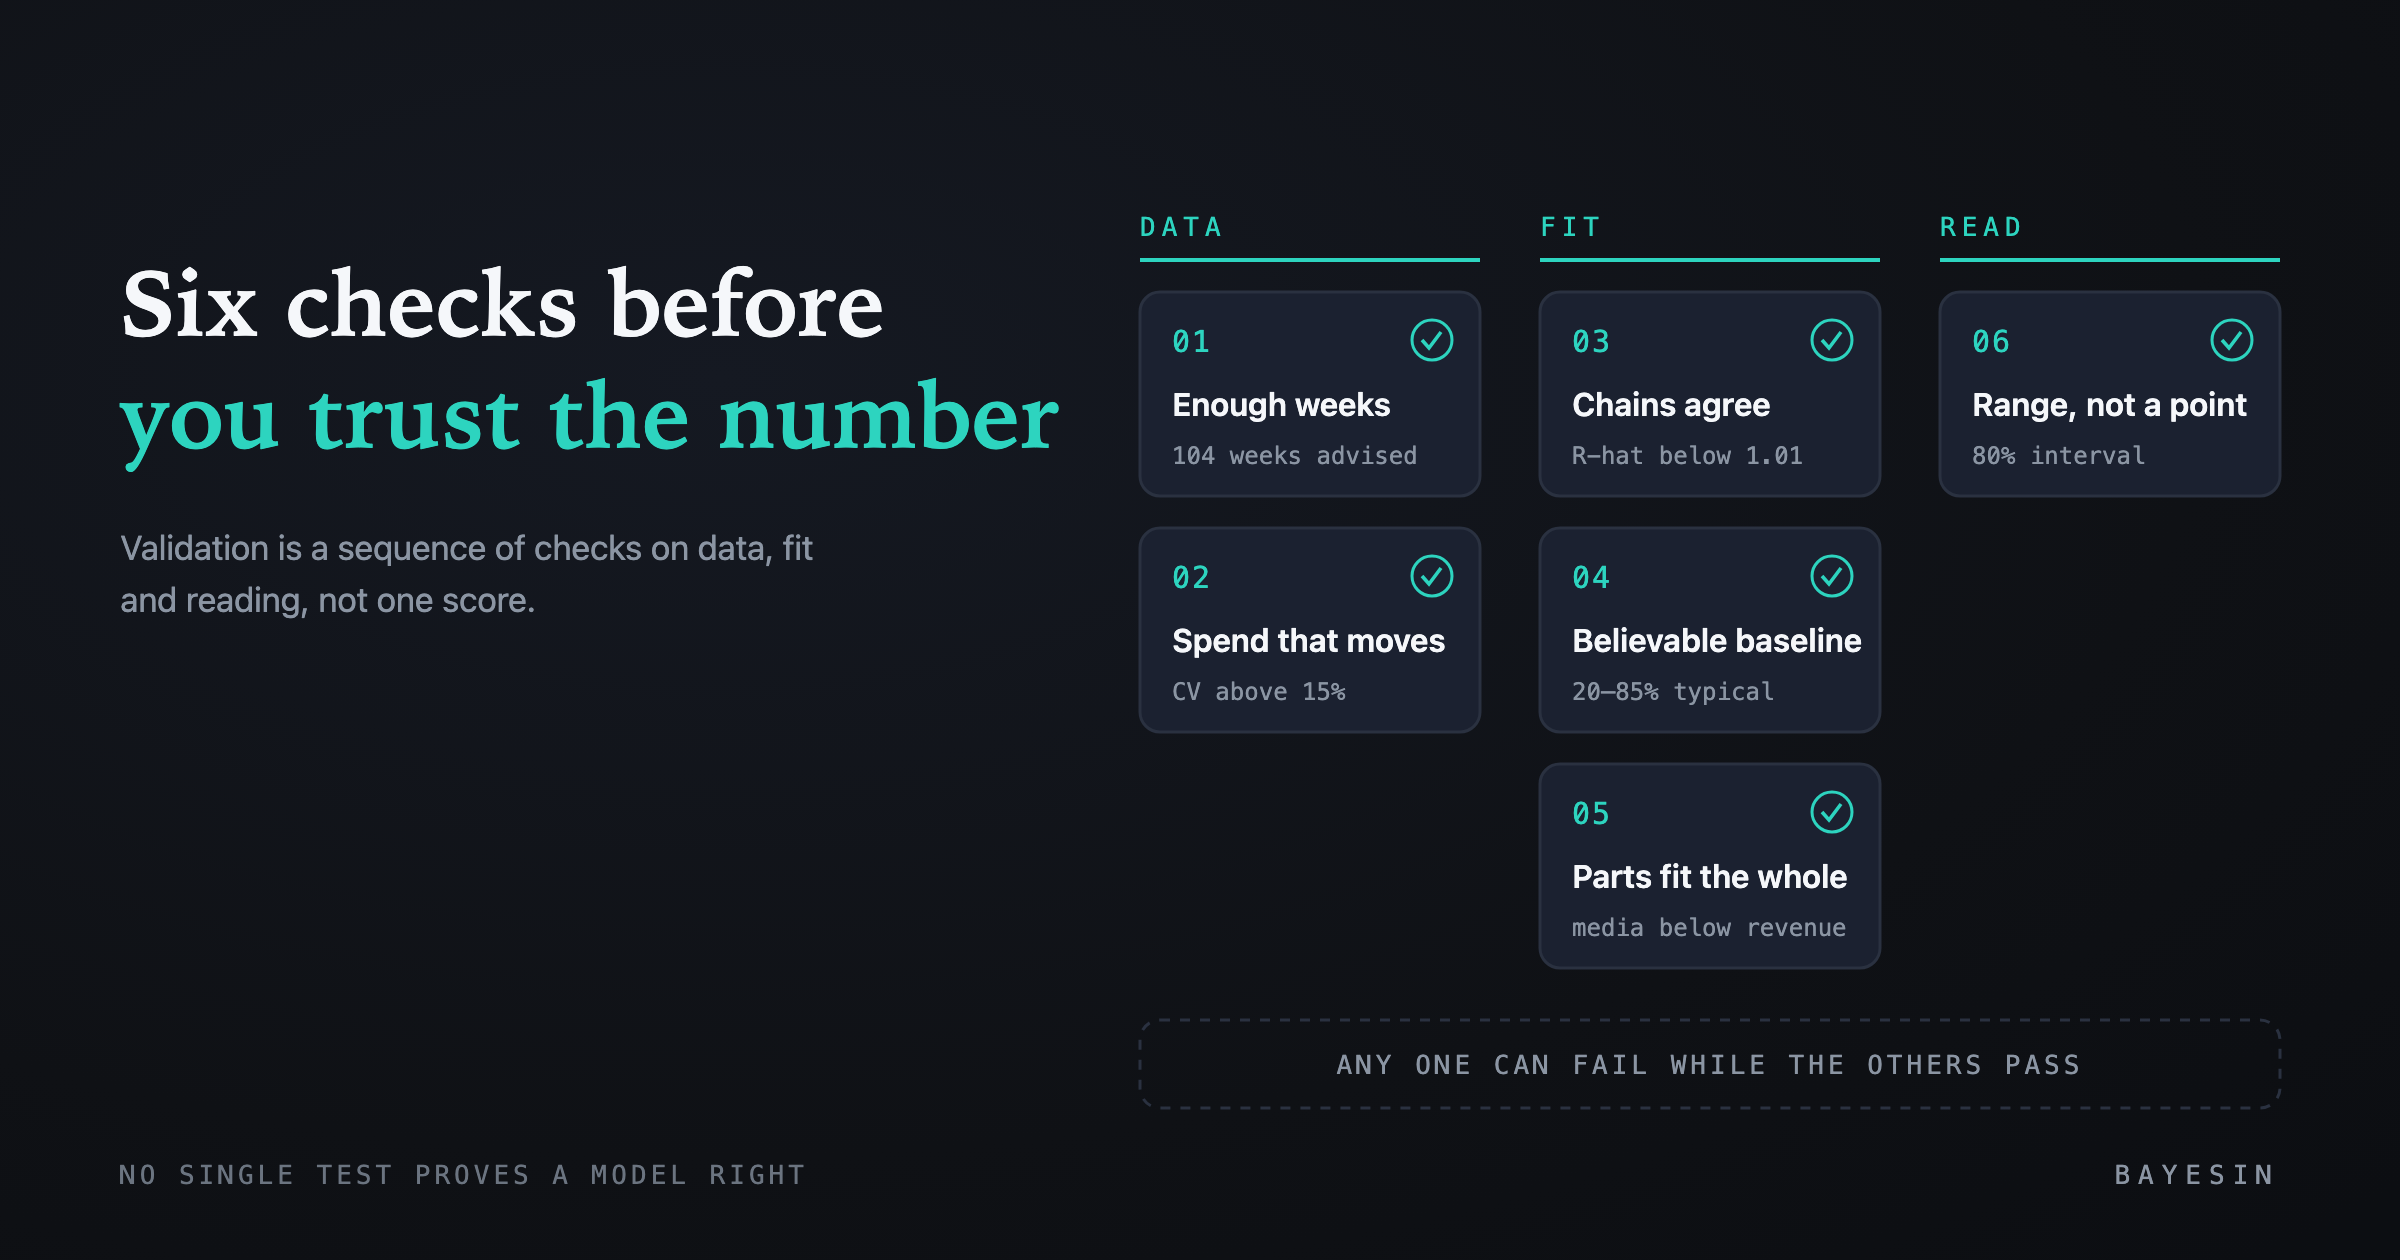
- No single test proves a marketing mix model right. Validation is a sequence of checks on the data, the fit and the reading of the result.
- Six checks cover most of the risk: enough weeks, spend that moves, chains that agree, a sensible baseline share, contribution inside revenue, and intervals read as ranges.
- Published tools set different bars, so know which one your tool applies and whether a failure blocks the result.
- A model that can refuse a fit it cannot defend is more useful than one that always answers.
A marketing mix model will return numbers whether or not the data can support them. That is a property of estimation rather than a criticism of any tool. The useful question is not whether the model produced an answer, but whether you would commit a budget to it, and how you would check.
This guide is my working answer to how to validate a marketing mix model. It gathers the checks I trust into one order, explains the reasoning behind each, and links to a deeper post on every one. The thresholds come from published documentation and research. A few come from the platform's own code, so you can compare them with whatever tool you use.
How to validate a marketing mix model in six checks
Validating a mix model means testing whether its output can carry a decision, and that verdict cannot be reduced to a single score. It combines checks on the data, on the fitting procedure and on the plausibility of the result, followed by a careful reading of uncertainty. Any one of these can fail while the others pass.
The wider Bayesian literature frames the task the same way. In 2020, Gelman and colleagues described a Bayesian workflow covering model construction, evaluation, validation and comparison. They noted that practitioners usually build several models for one problem, and checking a model is part of the method rather than an extra.
Validation also has a boundary. These checks test whether a model is internally sound and consistent with your data, not whether a channel caused revenue. I return to that limit near the end.
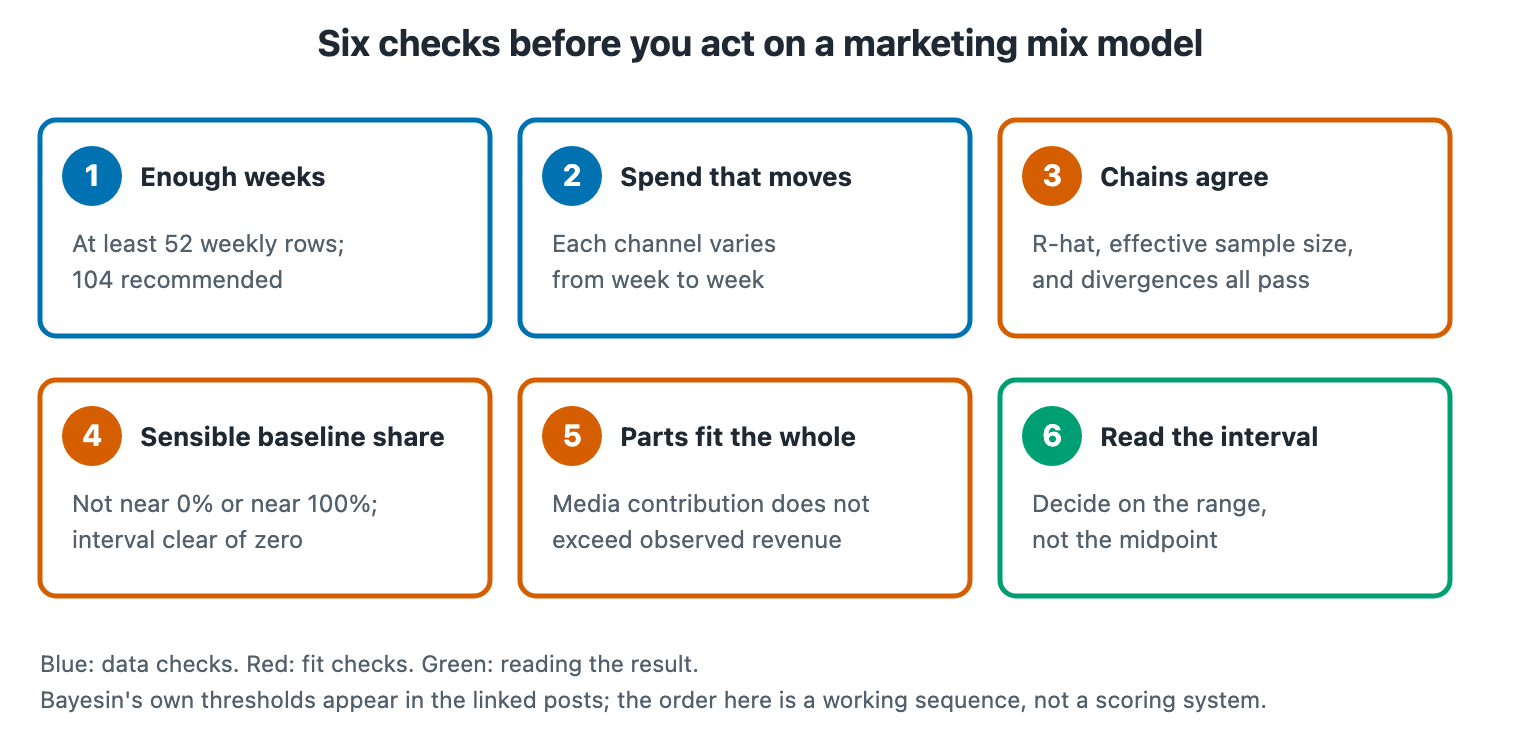
Figure 1. The six checks in the order I run them. Blue boxes are data checks, red are fit checks, green is reading the result.
- 1. Enough weeks — Question it answers: Can the model separate media from seasonality?; Where to read more: How much data marketing mix modeling needs
- 2. Spend that moves — Question it answers: Is there contrast to learn each channel from?; Where to read more: Constant spend
- 3. Chains that agree — Question it answers: Has the sampler settled on one answer?; Where to read more: Convergence and R-hat
- 4. Sensible baseline share — Question it answers: Is the split between media and baseline believable?; Where to read more: Baseline share
- 5. Contribution inside revenue — Question it answers: Do the parts add up to less than the whole?; Where to read more: When to distrust results
- 6. Intervals read as ranges — Question it answers: Is each range narrow enough for the decision?; Where to read more: Credible intervals
Data checks come first
No fitting method can add information that the data lacks, so check the data before the fit. Two questions matter most: are there enough weekly rows, and does each channel's spend actually move? Both questions can be answered from your own spreadsheet within minutes, before any model runs.
Check 1: enough weeks
There is a floor below which a model cannot separate media from seasonality, and a longer length at which intervals become useful. Meta's Robyn guide says robust results need at least two years of weekly data, and Google's Meridian documentation works an example with 26 parameters. Two years of data gives four data points per parameter, which it calls too low, and it points to three years for that national model.
The platform blocks a fit below 52 weeks and recommends 104, and between those lengths, it runs with a warning that intervals will be wide. Below 61 weeks it also skips its accuracy check on held-back weeks. How much data marketing mix modeling needs gives the full table of thresholds and the reasoning behind each.
Check 2: spend that moves
A model learns a channel's effect by comparing weeks of higher spend with weeks of lower spend. If a channel is constant, nothing is left to compare, and a longer history of flat spend is still flat. Robyn's guide states the constant-spend case directly: when sales vary weekly while TV activity stayed constant, the model can struggle to determine TV's effect.
Meridian's guidance covers two neighboring problems. Its data page notes that insufficient variation in media spend adversely affects national models. Its diagnostics page adds that low-spend channels tend to have a posterior similar to their prior. Low spend and constant spend are different conditions, though they share a mechanism.
The platform measures spread as the coefficient of variation of weekly spend and warns below 15% of a channel's own average. It warns rather than blocks, because the rest of the model stays valid. The details are in why a channel with constant spend cannot be measured.
Confirming that the fit itself is sound
A fit is sound when the sampler has settled, the split of revenue is plausible, and the model predicts weeks it has not seen. These are separate tests, and a fit can pass one while failing another, so run all three against the published guidance.
Check 3: chains that agree
A Bayesian model is fitted by running several chains, each a search for plausible parameter values. If the chains disagree, the posterior cannot be trusted, however tight the resulting ranges look. Three diagnostics cover the question: R-hat, effective sample size and divergences.
The bars differ by source, and Stan advises fully trusting a sample only when R-hat is below 1.01. For final results, it also recommends a bulk effective sample size above 100 per chain. Meridian's health check passes a model whose largest R-hat is below 1.2. The platform uses the stricter Stan bar and treats any divergence as a failure. MMM convergence and R-hat for non-statisticians explains each diagnostic in plain terms.
Check 4: a sensible baseline share
A mix model divides revenue into a baseline and media contributions, and baseline share is the part it does not credit to media. A tiny baseline share, such as media receiving 99% of revenue, is a warning, because it implies revenue would nearly vanish without marketing.
Measured's QA guide gives 40 to 70 percent as typical for established brands and flags results below 20 or above 85 percent. Those bounds question a result without proving it wrong, since a young or acquisition-heavy business can sit outside them. The platform refuses a fit when baseline share is below zero or above 95%, and when the 10th to 90th percentile range includes zero. See what a baseline share too high or too low means.
Check 5: contribution inside revenue
The parts must fit the whole. If the media contributions add up to more than the revenue you booked, the decomposition does not close, and no channel figure is worth reading. Meridian's health checks treat a consistently negative baseline as a clear problem for the same reason. It implies that sales would go negative without marketing.
The usual causes are spend that barely varies, and credits or refunds posted as negative spend. Both are data problems, which is why this check follows the data checks in the order I run them.
Did the model predict weeks it had not seen?
An accuracy check holds back the most recent weeks, fits the model on the rest, and measures how wrong it would have been. Without it, the numbers describe history rather than a demonstrated forecast. Measured lists out-of-sample accuracy among its five sanity checks, next to reconciliation, directional logic, response-curve shape and alignment with experiments.
The platform holds back 8 weeks and needs 61 weeks in total. With less history, it says so and states that no accuracy figure stands behind the numbers.
Reading the answer once a fit passes
Check 6: intervals read as ranges
Read each figure as a range rather than a point, because the credible interval tells you how much weight a number can bear. Look at the ends, and ask whether your decision changes anywhere inside the range. Treat width as information about the data rather than as a defect in the report.
An 80% credible interval means the model places 80% of its belief inside the range. Wide ranges usually mean too few weeks, flat spend, or channels that rise and fall together. The platform reports an 80% interval on each channel's return on ad spend, from the 10th to the 90th percentile of the posterior. The stylized chart below shows why more weeks narrow a range, and it uses an assumed shape, so it teaches direction rather than exact values.
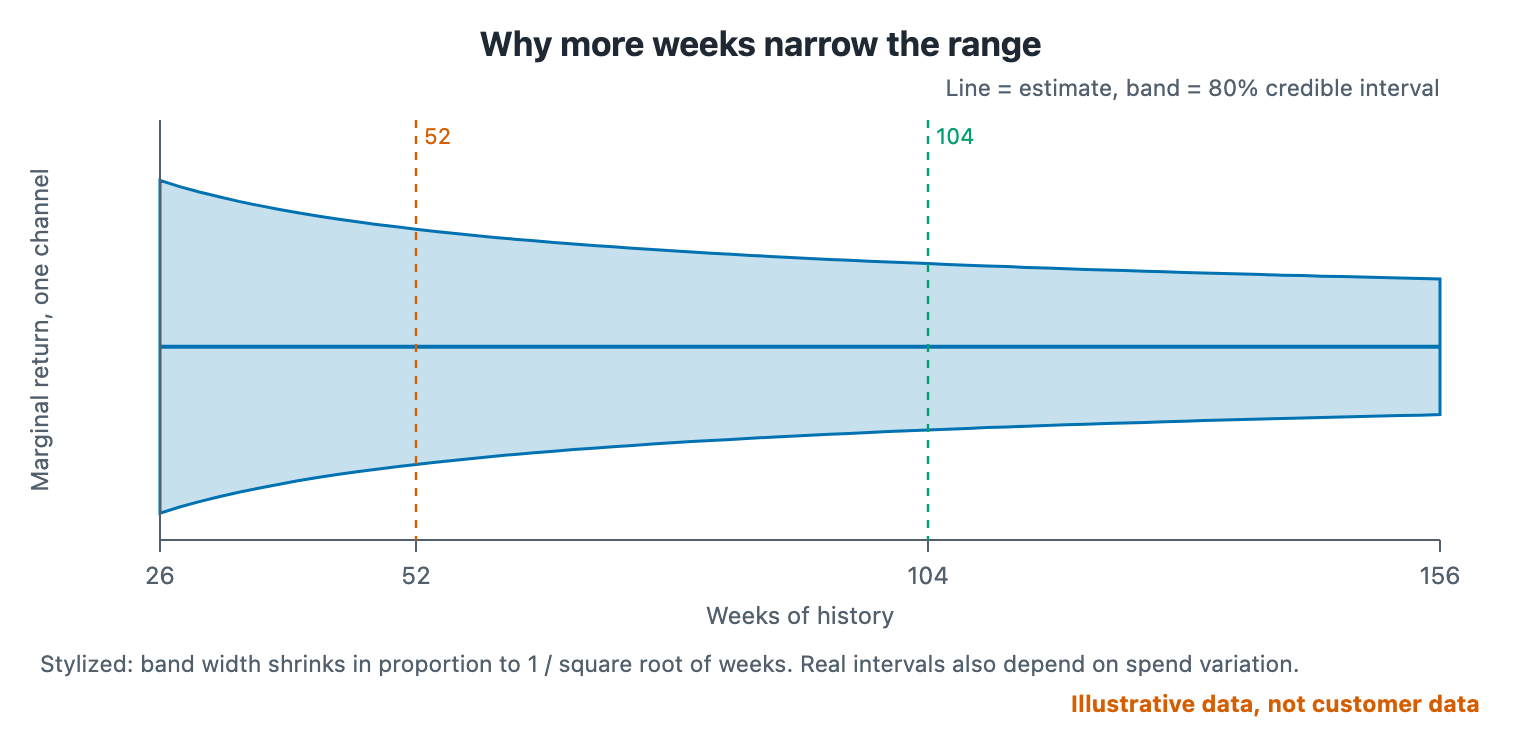
Figure 2. A stylized interval narrowing with history. Real intervals also depend on spend variation.
A recommended allocation inherits the uncertainty behind it, and the research on media mix optimization documents this. The interval post, reading a credible interval in a marketing mix model, gives a four-step method and separates credible from confidence intervals. It includes a table of four illustrative channels.
When a model should refuse to answer
A model should refuse when a check shows the number would not be evidence. The arithmetic does not close, the baseline cannot be identified, media gets almost no credit, or the sampler has not settled. It should warn, not refuse, when it measured something and the answer is merely unusual.
That split is the core of my view. A refused fit costs you a number today, whereas a published bad fit can cost you a budget decision next quarter. The table lists how the platform draws the line.
- Baseline share below 0% — Action: Refuses; Why: The split does not close
- Baseline range includes zero — Action: Refuses; Why: The data does not answer the question
- Baseline share above 95% — Action: Refuses; Why: Media gets almost no credit
- Sampler unsettled (main or holdout fit) — Action: Refuses; Why: The posterior cannot be trusted
- Baseline share 0% to 20%, range clear of zero — Action: Publishes with a caveat; Why: Measured, but unusual
- Baseline share 85% to 95% — Action: Publishes with a caveat; Why: Channels may be inseparable
- History under 61 weeks — Action: Publishes with a caveat; Why: No accuracy check
- History under 52 weeks — Action: Blocks the mix model; Why: Seasonality cannot be separated
- Flat channel — Action: Warns, still fits; Why: The channel cannot be separated from baseline
I draw the line by what a breach means rather than by how bad it looks. A refusal fits a fit that did not measure the target, since there is no number to caveat. A warning fits a fit that measured something surprising, because a business can genuinely buy most of its demand. Withholding that finding would teach readers to distrust every caveat.
A refusal is useful only if the message explains itself. It states the problem first, then a test you can run on your own business, then the statistics in parentheses. The argument in full, with an example refusal message, is in when to distrust marketing mix model results.
How the published tools compare on these checks
The tools agree on the ideas and differ on the bars. Every source I read treats convergence, spend variation, data length and baseline plausibility as things to check. They set different thresholds because they serve different uses, from early exploration to decisions that move budget.
- R-hat — Stan guidance: Below 1.01 for final results; Meridian documentation: Health check passes below 1.2; Robyn guide: Not stated in the guide I read; Bayesin: Below 1.01
- Effective sample size — Stan guidance: Bulk above 100 per chain; Meridian documentation: Not stated on pages I read; Robyn guide: Not applicable; Bayesin: At least 100 per chain, bulk and tail
- History length — Stan guidance: Not applicable; Meridian documentation: Three years for a national model with many channels; Robyn guide: At least two years weekly; Bayesin: Block below 52 weeks, recommend 104
- Spend variation — Stan guidance: Not applicable; Meridian documentation: Debugging page asks whether variation is too small; Robyn guide: Constant channel is hard to measure; Bayesin: Warn below 15% variation
- Baseline — Stan guidance: Not applicable; Meridian documentation: Negative baseline is a clear problem; Robyn guide: Not stated; Bayesin: Refuse below 0%; caveat outside 20% to 85%
Read the table as a map of who says what rather than as a ranking. A looser bar suits an exploratory first look, and a stricter bar suits a fit that will move budget. Whichever you choose, apply it consistently and record it.
What to do when a check fails
Most failures point to data you can add. More weeks, independent budget changes and direct experiments are the usual remedies, whereas rerunning the model or running it longer helps only in some cases. Start with the data, and treat sampler settings as a second step.
Meridian's debugging page lists causes and remedies. The causes include a poorly specified model, insufficient warmup or sampling, too little data, and media or controls that vary too little to estimate. The remedies include more iterations, more data and more variation.
A short guide to matching failure to remedy:
- Too few weeks. Add history, and use observed revenue and spend views in the meantime.
- Flat channel. Add variation on purpose, combine it with a similar channel, or set it aside as baseline with a clear note.
- Chains disagree. Run again once, since a bad start is sometimes the cause, then look for too few weeks or channels that move together.
- Extreme baseline share. Compare against your lowest-spend weeks, and check whether spend ever dropped or varied.
- Interval too wide. Make a small reversible move, add contrast, and consider an experiment.
For experiments, the evidence base is strong. In 2011, Vaver and Koehler at Google described geo experiments, in which non-overlapping regions are randomly assigned to control or treatment. Robyn's guide strongly recommends calibrating a mix model with experimental results treated as ground truth.
Running the six checks in an afternoon
For a typical dataset, you can run the checks in an afternoon. Work through the six questions in order and stop at the first failure, then fix it and continue. The list mirrors Figure 1 and needs only your weekly data and the model's report.
- Weeks. Do you have at least a year of unbroken weekly rows, ideally two, with zero-spend weeks included?
- Variation. Does each channel's weekly spend move, with a spread well above a few percent of its average?
- Chains. Is the largest R-hat below your bar, are effective sample sizes above 100 per chain, and are divergences zero?
- Baseline share. Is it inside a range you can defend, with an interval that stays clear of zero?
- Parts and whole. Do media contributions add up to less than observed revenue?
- Intervals. Is each interval narrow enough for the decision you are about to make?
Write the answers down, with the thresholds you used and the date. A record makes the next review faster, and it lets a colleague or finance partner see what you checked. It also shows which checks failed and what you did about them.
- Date and data window — 2026-09-18; weeks 1 to 104
- Threshold set — R-hat below 1.01; ESS at least 100 per chain
- Check that failed — Check 2: one channel with CV of 0.02
- Action taken — Planned a four-week spend step on that channel
Limits of these checks
These checks show that a model is internally sound and consistent with your data, but they do not prove causation. A model can pass all six and still misattribute credit, for example when an unmeasured factor drives both spend and sales. Experiments are the strongest complement to any mix model.
Meridian's calibration page adds a caution about combining the two, and it says that no single formula translates experiment results into priors. Experiments and mix models can also measure ROI differently, with timing, duration and geography that may not line up.
Chan and Perry at Google described the underlying difficulty in 2017. They identified obstacles that keep media mix models from consistently giving valid answers about media effectiveness. Checks reduce risk, but they do not remove it.
I treat a passed validation as permission to use the numbers as one input, alongside experiments, judgment and what you know about your business. I do not treat it as a certificate.
Questions worth asking before you trust a model
Is my MMM accurate?
Accuracy has no single test. Check that the data is sufficient, the sampler converged, the baseline share is plausible, and the model predicted held-back weeks, then read the intervals. If all pass, the model is internally sound, but whether it matches causal reality is best tested with experiments.
What is the quickest sanity check I can run?
Compare the model's baseline share with your lowest-spend weeks. If revenue in those weeks stayed near normal, a tiny baseline cannot be right, and the comparison takes minutes and needs no statistics. Then confirm that each channel's spend actually varied.
How often should I revalidate?
Rerun the checks whenever the model is refit or the data changes materially, such as new weeks, a new channel or a large budget shift. Keep the thresholds fixed between runs so results are comparable, and change them only deliberately, with a note explaining why.
Should I trust a model that never refuses?
A model that never refuses gives every fit the same look, so you cannot tell strong from weak. That does not make its numbers wrong. It means you must run the checks yourself, so ask which checks your tool applies and whether a failure blocks a result.
Do I need a statistician to do this?
No. Each check here can be run from a report and your own weekly data, and the linked posts explain the terms in plain language. A statistician helps with unusual designs or disputed results, but the six checks are within reach of a marketing or finance lead.
Sources
- Gelman, A., Vehtari, A., Simpson, D. et al., "Bayesian Workflow," arXiv
- Stan Development Team, "How to Diagnose and Resolve Convergence Problems," mc-stan.org
- Google for Developers, "Model health checks," Meridian documentation
- Google for Developers, "Amount of data needed," Meridian documentation
- Google for Developers, "Run model diagnostics," Meridian documentation
- Google for Developers, "Model debugging," Meridian documentation
- Google for Developers, "Calibrate treatment priors," Meridian documentation
- Robyn (Meta open source), "An Analyst's Guide to MMM"
- Measured, "How to QA an MMM: Top 5 Sanity Checks Before You Trust the ROI Numbers"
- Chan, D. and Perry, M., "Challenges and Opportunities in Media Mix Modeling," Google Research
- Vaver, J. and Koehler, J., "Measuring Ad Effectiveness Using Geo Experiments," Google Research
See it on your own rows.
Bayesin is pre-launch. Join the waitlist and we will reach out as access opens.
Get new posts by email.
New posts only. See privacy for what we keep.