Trusting a model
MMM convergence and R-hat for non-statisticians
MMM convergence R-hat explained without jargon: R-hat, effective sample size and divergences, and why Stan asks for below 1.01 while Meridian passes 1.2.
Brandon Cade · Sep 30, 2026 · 8 min read
Key Takeaways
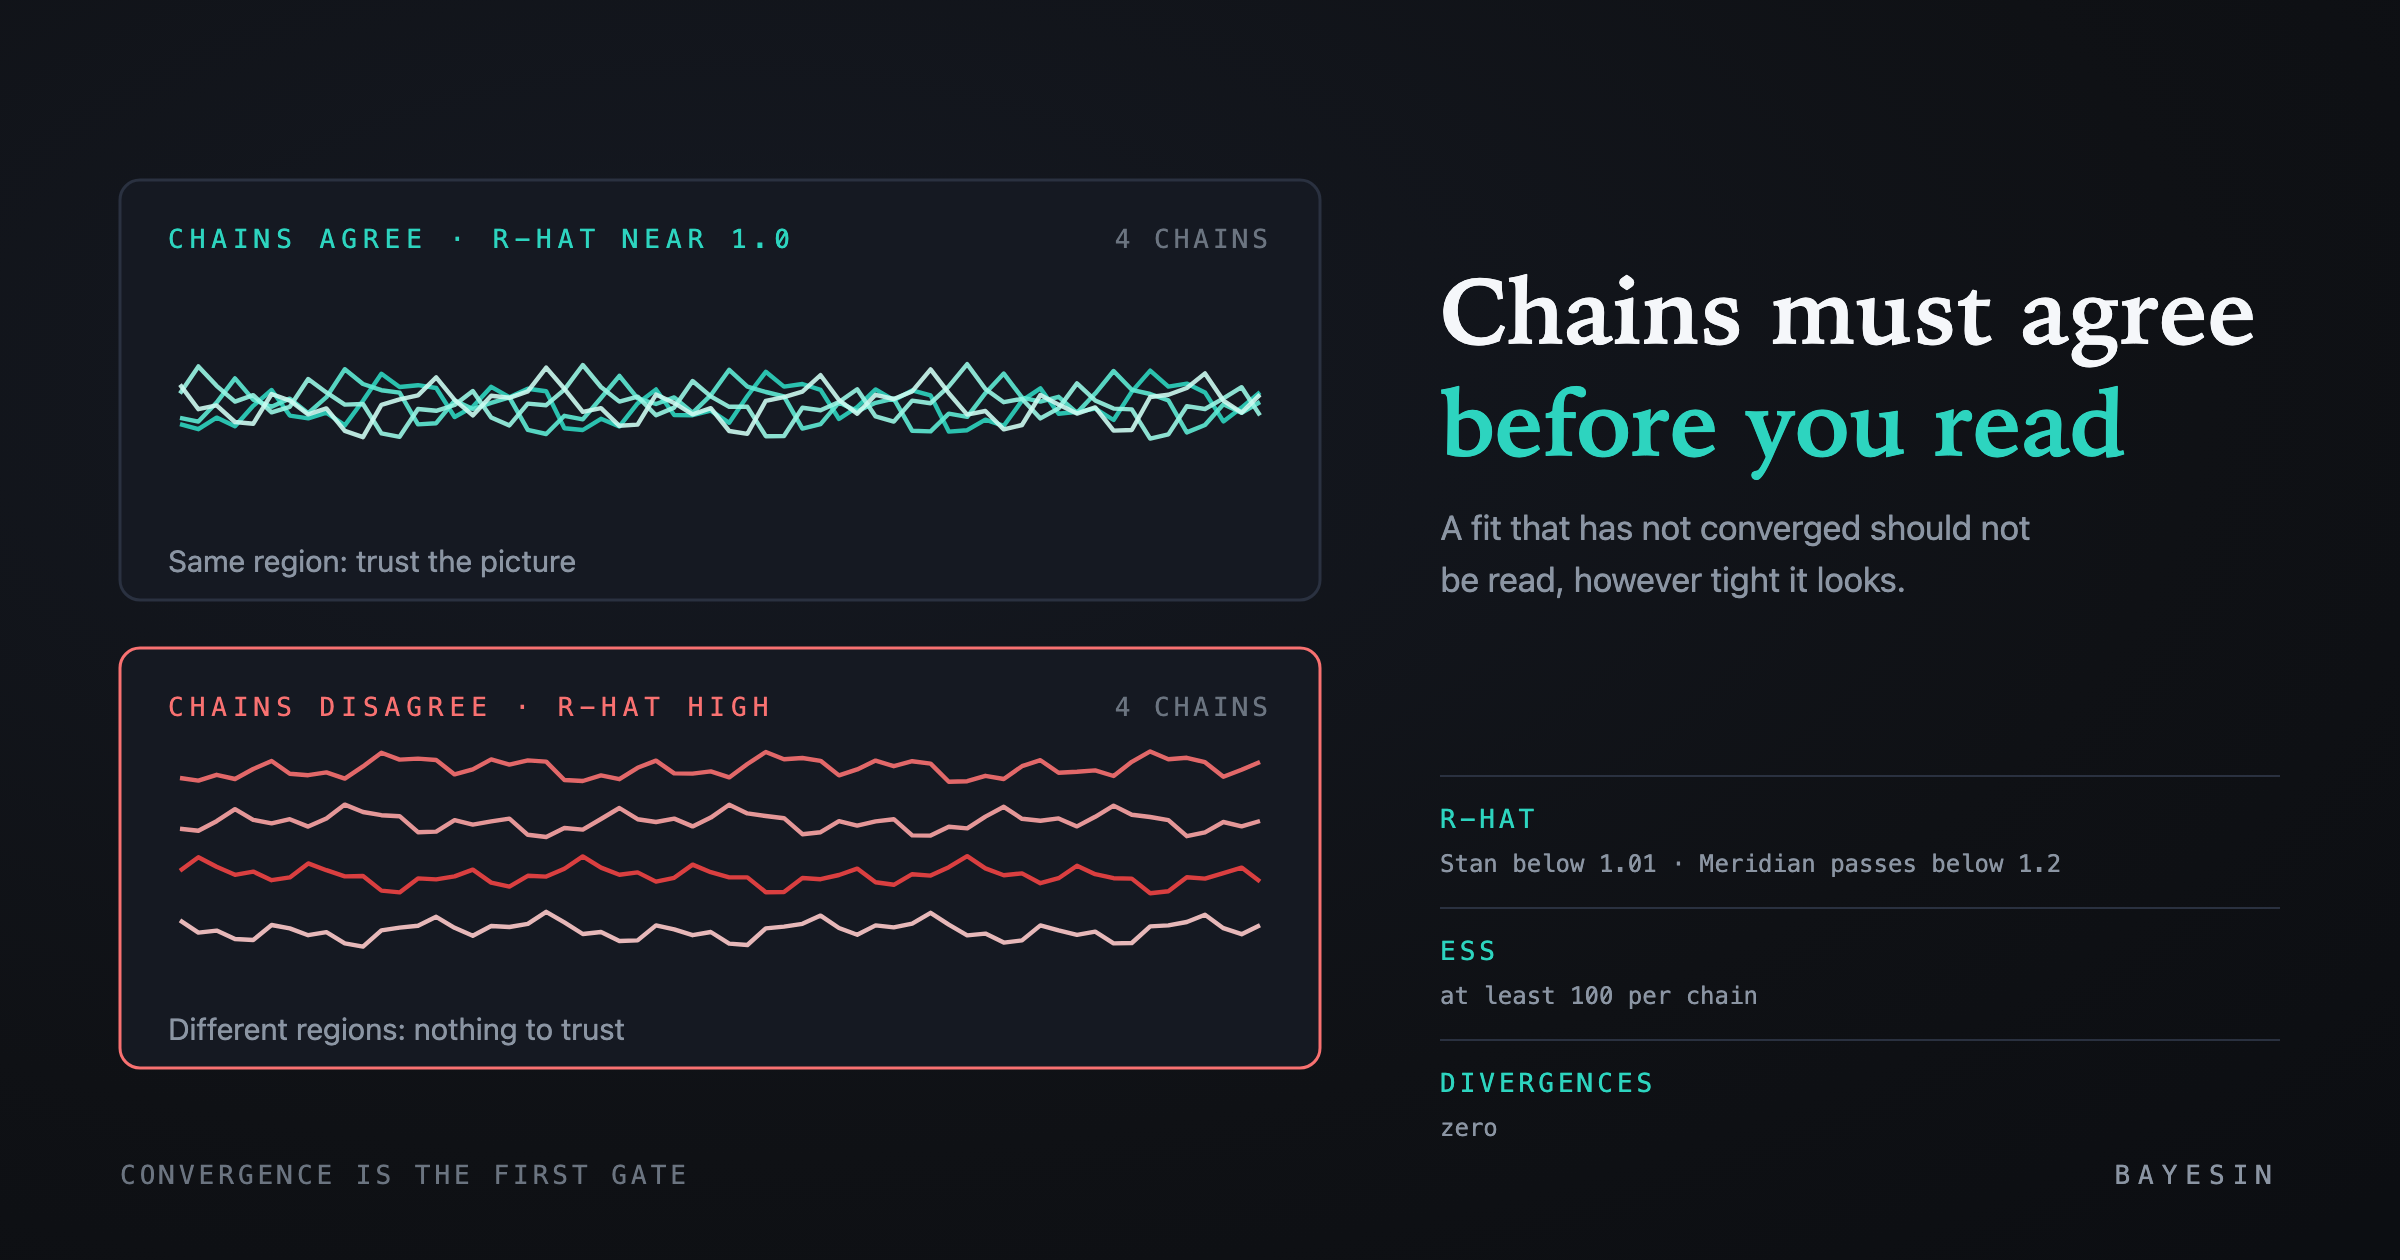
- A Bayesian mix model runs several chains, each a separate search for plausible answers, and convergence means the chains agree.
- Three diagnostics cover most of what you need: R-hat, effective sample size and divergences.
- Tools set different bars. Stan advises R-hat below 1.01 for final results, while Meridian's health check passes a fit below 1.2.
- A fit that has not converged should not be read, however tight its intervals look.
You do not need a statistics degree to read a convergence report. You must understand what three numbers ask and what to do when one fails. This tutorial covers MMM convergence R-hat values first, then effective sample size and divergences, using plain analogies and the thresholds that tool builders publish. The guide to validating a marketing mix model places convergence among the other checks.
What convergence means in a marketing mix model
Convergence means that several independent searches for the model's parameters arrive at the same answer. Bayesian models are fitted by sampling, and the sampler runs chains, each a long walk through plausible parameter values. If every chain ends up describing the same region, the shared picture is trustworthy, whereas chains describing different regions leave nothing to rely on.
Think of four surveyors sent to map the same hill, each starting from a different corner. If their maps match, you can rely on the result. A peak on one map and a valley on another means you cannot tell which is correct.
For scale, the PyMC-Marketing example notebook fits a weekly media mix model with 4 chains of 1,000 draws each on 179 weekly observations. By default, the platform's worker also runs four chains of 1,000 draws after 1,000 tuning steps.
MMM convergence R-hat: which value to look for
R-hat compares how much the chains differ from one another with how much each chain varies within itself. A value near 1.0 means that the chains agree, and higher values indicate disagreement, so guidance on the cutoff matters and differs between sources.
The Stan project advises trusting a sample fully only when R-hat is below 1.01. For early exploratory work, it says a value below 1.1 suffices. Meridian is considerably more permissive, since Google's documentation describes values close to 1.0 as convergence and below 1.2 as approximate convergence. Its health check passes a model when the largest R-hat is under 1.2.
Neither bar is wrong, because each answers a different question about how much risk a particular analysis can tolerate. A stricter bar suits a fit that will drive a budget decision, while a looser bar suits a first exploratory look. The platform applies the stricter Stan bar and rejects any fit whose largest R-hat across all checked parameters reaches 1.01.
Why the R-hat formula changed
The older version of R-hat had a subtle flaw. In 2021, Vehtari and colleagues showed that the classic version can miss failures such as heavy-tailed chains and unequal variance across chains. They proposed a rank-based version, and it is worth checking which version your software reports.
What effective sample size tells you
Effective sample size, or ESS, counts how many independent draws your correlated draws are worth. In a made-up case, a chain of 1,000 draws might carry the information of only 200 independent ones, because each step depends on the last. A low ESS means the reported averages are noisy even when R-hat looks acceptable.
Stan's guidance for final results is that bulk ESS should exceed 100 times the number of chains, which is 400 with four chains. It also describes tail ESS, which tests how well the 5% and 95% ends of the distribution are resolved. Tail ESS matters for anything you report as an interval, because an interval is a pair of tail values, so unresolved tails give unreliable ranges.
The platform checks both measures and requires bulk and tail ESS of at least 100 per chain. It also verifies that the Monte Carlo error on each average is no more than a tenth of that parameter's own spread.
What a divergence is
A divergence is a warning from the sampler that it entered a region it could not explore reliably. It usually means the model's shape is awkward there. Divergences form a separate check from R-hat, and they can appear even when R-hat looks acceptable.
In a 2017 case study, Michael Betancourt explained that divergences indicate regions of high curvature that the sampler cannot adequately explore. The resulting estimates can be biased. Stan's guidance says that a small number of divergences after warmup cannot be safely ignored if you want completely reliable inference. It allows that a few, alongside good R-hat and ESS values, may be acceptable while you are still exploring a model.
The platform treats any divergence as a failure, and a single divergence marks the fit as not converged and prevents its publication.
Reading a convergence report in four passes
Read a report in four passes covering chains, R-hat, effective sample size and divergences. Each pass asks one question, and any failure stops the read. Start with the picture of the chains, then confirm what you see against the numbers, using the worst value each time.
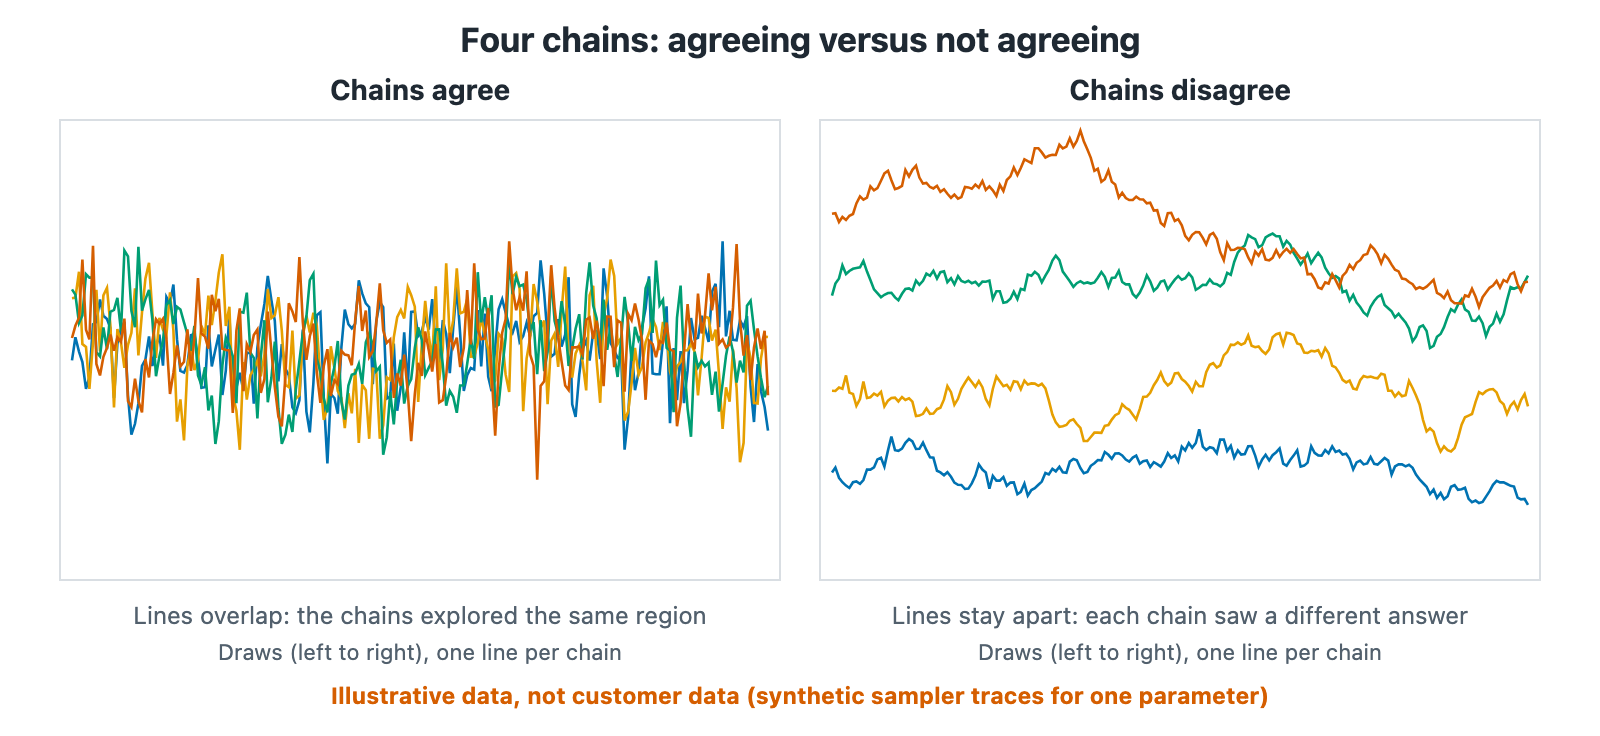
Figure 1. Chains that agree versus chains that disagree.
- Look at the chains. On a trace plot, healthy chains overlap like a fuzzy caterpillar, whereas chains that sit apart or drift have not converged.
- Check the largest R-hat. Use one number for the whole model, the worst parameter, and compare it with your bar, such as 1.01.
- Check the smallest ESS. Again use the worst parameter, and compare bulk and tail ESS with 100 times the number of chains.
- Count divergences. For a fit that will drive a budget, the target is zero.
Use the worst value, not the average, because one unstable parameter is enough to undermine the fit.
Consider an illustrative pair of reports, built from synthetic numbers with four chains in each. Report A shows a largest R-hat of 1.004, a smallest bulk ESS of 640 against a bar of 400, and zero divergences, so it passes. Report B shows a largest R-hat of 1.03, which fails the 1.01 bar even though its intervals look tight. The intervals in Report B describe a sampler that had not settled, so I would not interpret them at all.
The platform stores the largest R-hat, smallest ESS and divergence count for each run, so a published run can be audited afterward.
What to do when a fit does not converge
Run it again first, since a bad start is sometimes the cause, and if the failure repeats, look at the data. The usual causes are too few weeks, or channels whose spend moves together so closely that many different answers fit equally well.
Google's Meridian debugging page lists causes and remedies. It names a poorly specified model, insufficient warmup or sampling, and too little data for the number of variables. It adds media or controls that vary too little to estimate. Its remedies include more iterations, more data and more variation.
Notice how many remedies live in the data rather than in the sampler settings. Adding weeks or varying spend independently across channels often assists more than running the sampler longer.
For related failures, see when to distrust marketing mix model results, where convergence is one of four blocking checks. Also see the guide to an MMM baseline share that is too high or too low. A poorly identified split often arrives with a failed convergence check.
Thresholds side by side
This table collects the bars discussed above in one place. Stan and Meridian figures come from their current documentation, and the final column is the platform's rule. Use the table as a quick reference when you review any fit.
- R-hat — What it asks: Do chains agree?; Stan guidance: Below 1.01 for final results; Meridian health check: Pass below 1.2; Bayesin: Below 1.01
- Bulk ESS — What it asks: Are averages stable?; Stan guidance: Above 100 per chain; Meridian health check: Not stated on the pages I reviewed; Bayesin: At least 100 per chain
- Tail ESS — What it asks: Are interval ends stable?; Stan guidance: Reported alongside bulk ESS; Meridian health check: Not stated on the pages I reviewed; Bayesin: At least 100 per chain
- Divergences — What it asks: Did the sampler stumble?; Stan guidance: Not safely ignorable; Meridian health check: Not stated on the pages I reviewed; Bayesin: Zero
Convergence is the first gate of validation rather than the last, because a converged fit can still be badly specified and needs further checks.
Common questions about convergence
Can a fit converge and still be wrong?
Yes, because convergence says only that the sampler explored the model's posterior well, and it says nothing about whether the model matches reality. A converged fit can still have a nonsensical baseline, too little history or flat channels. Treat convergence as necessary for trust but not sufficient.
Is R-hat below 1.2 good enough?
It depends on the use. Meridian's health check passes below 1.2, while Stan advises below 1.01 for final results. For a fit that will move budget, I prefer the stricter bar. For early exploration, the looser one is reasonable as long as you know which you applied.
What if R-hat is fine but the effective sample size is low?
Then the chains agree, but each carries little independent information, so your averages and intervals are noisy, and more draws can help. Persistent low ESS often points to strongly correlated parameters, such as channels whose spend moves together, so check that before running longer.
Do I need to compute these myself?
No, because good tools compute them and report the worst values. Your task is to know the bars and to confirm that a fit which fails them was not published as if it were sound. Ask which thresholds your tool applies, and whether a failure blocks the result.
If you would like a tool that applies these checks before showing a figure, you can request access at bayesin.com/request-access.
Sources
- Stan Development Team, "How to Diagnose and Resolve Convergence Problems," mc-stan.org
- Vehtari, A., Gelman, A., Simpson, D., Carpenter, B. and Bürkner, P.-C., "Rank-normalization, folding, and localization: An improved R-hat for assessing convergence of MCMC," Bayesian Analysis
- Betancourt, M., "Diagnosing Biased Inference with Divergences," Stan case study
- Google for Developers, "Model health checks," Meridian documentation
- Google for Developers, "Model debugging," Meridian documentation
- PyMC Labs, "Media Mix Model example notebook," PyMC-Marketing documentation
See it on your own rows.
Bayesin is pre-launch. Join the waitlist and we will reach out as access opens.
Get new posts by email.
New posts only. See privacy for what we keep.