Trusting a model
Reading a credible interval in a marketing mix model
How to read a credible interval in a marketing mix model in four steps, with an 80% interval from the 10th to 90th percentile, and what to do when it is wide.
Brandon Cade · Sep 30, 2026 · 8 min read
Key Takeaways
- A credible interval is a range that, given the model and data, holds the true value with a stated probability. An 80% interval holds it four times in five.
- Read the ends as well as the middle, and ask whether your decision changes anywhere inside the range.
- Width is information. A wide interval usually means too few weeks, flat spend, or channels that move together.
- A narrow interval does not prove a correct model, because it describes only the model's own certainty.
- A credible interval in a marketing mix model is the range the model considers plausible for a quantity such as a channel's return. The range can look like a hedge, yet I consider it the most useful part of the output. It shows how much weight a number can bear.
This guide explains what the range means, how to read it in four steps, and what to do when it is too wide. For the wider set of checks, see the guide to validating a marketing mix model. A shorter version is Reading a range instead of a single number.
What a credible interval in a marketing mix model tells you
A credible interval is a range of values that, according to the model and your data, contains the true value with a stated probability. An 80% credible interval means the model places 80% of its belief inside the range. It is built directly from the posterior, which is the model's complete description of what is plausible after seeing the data.
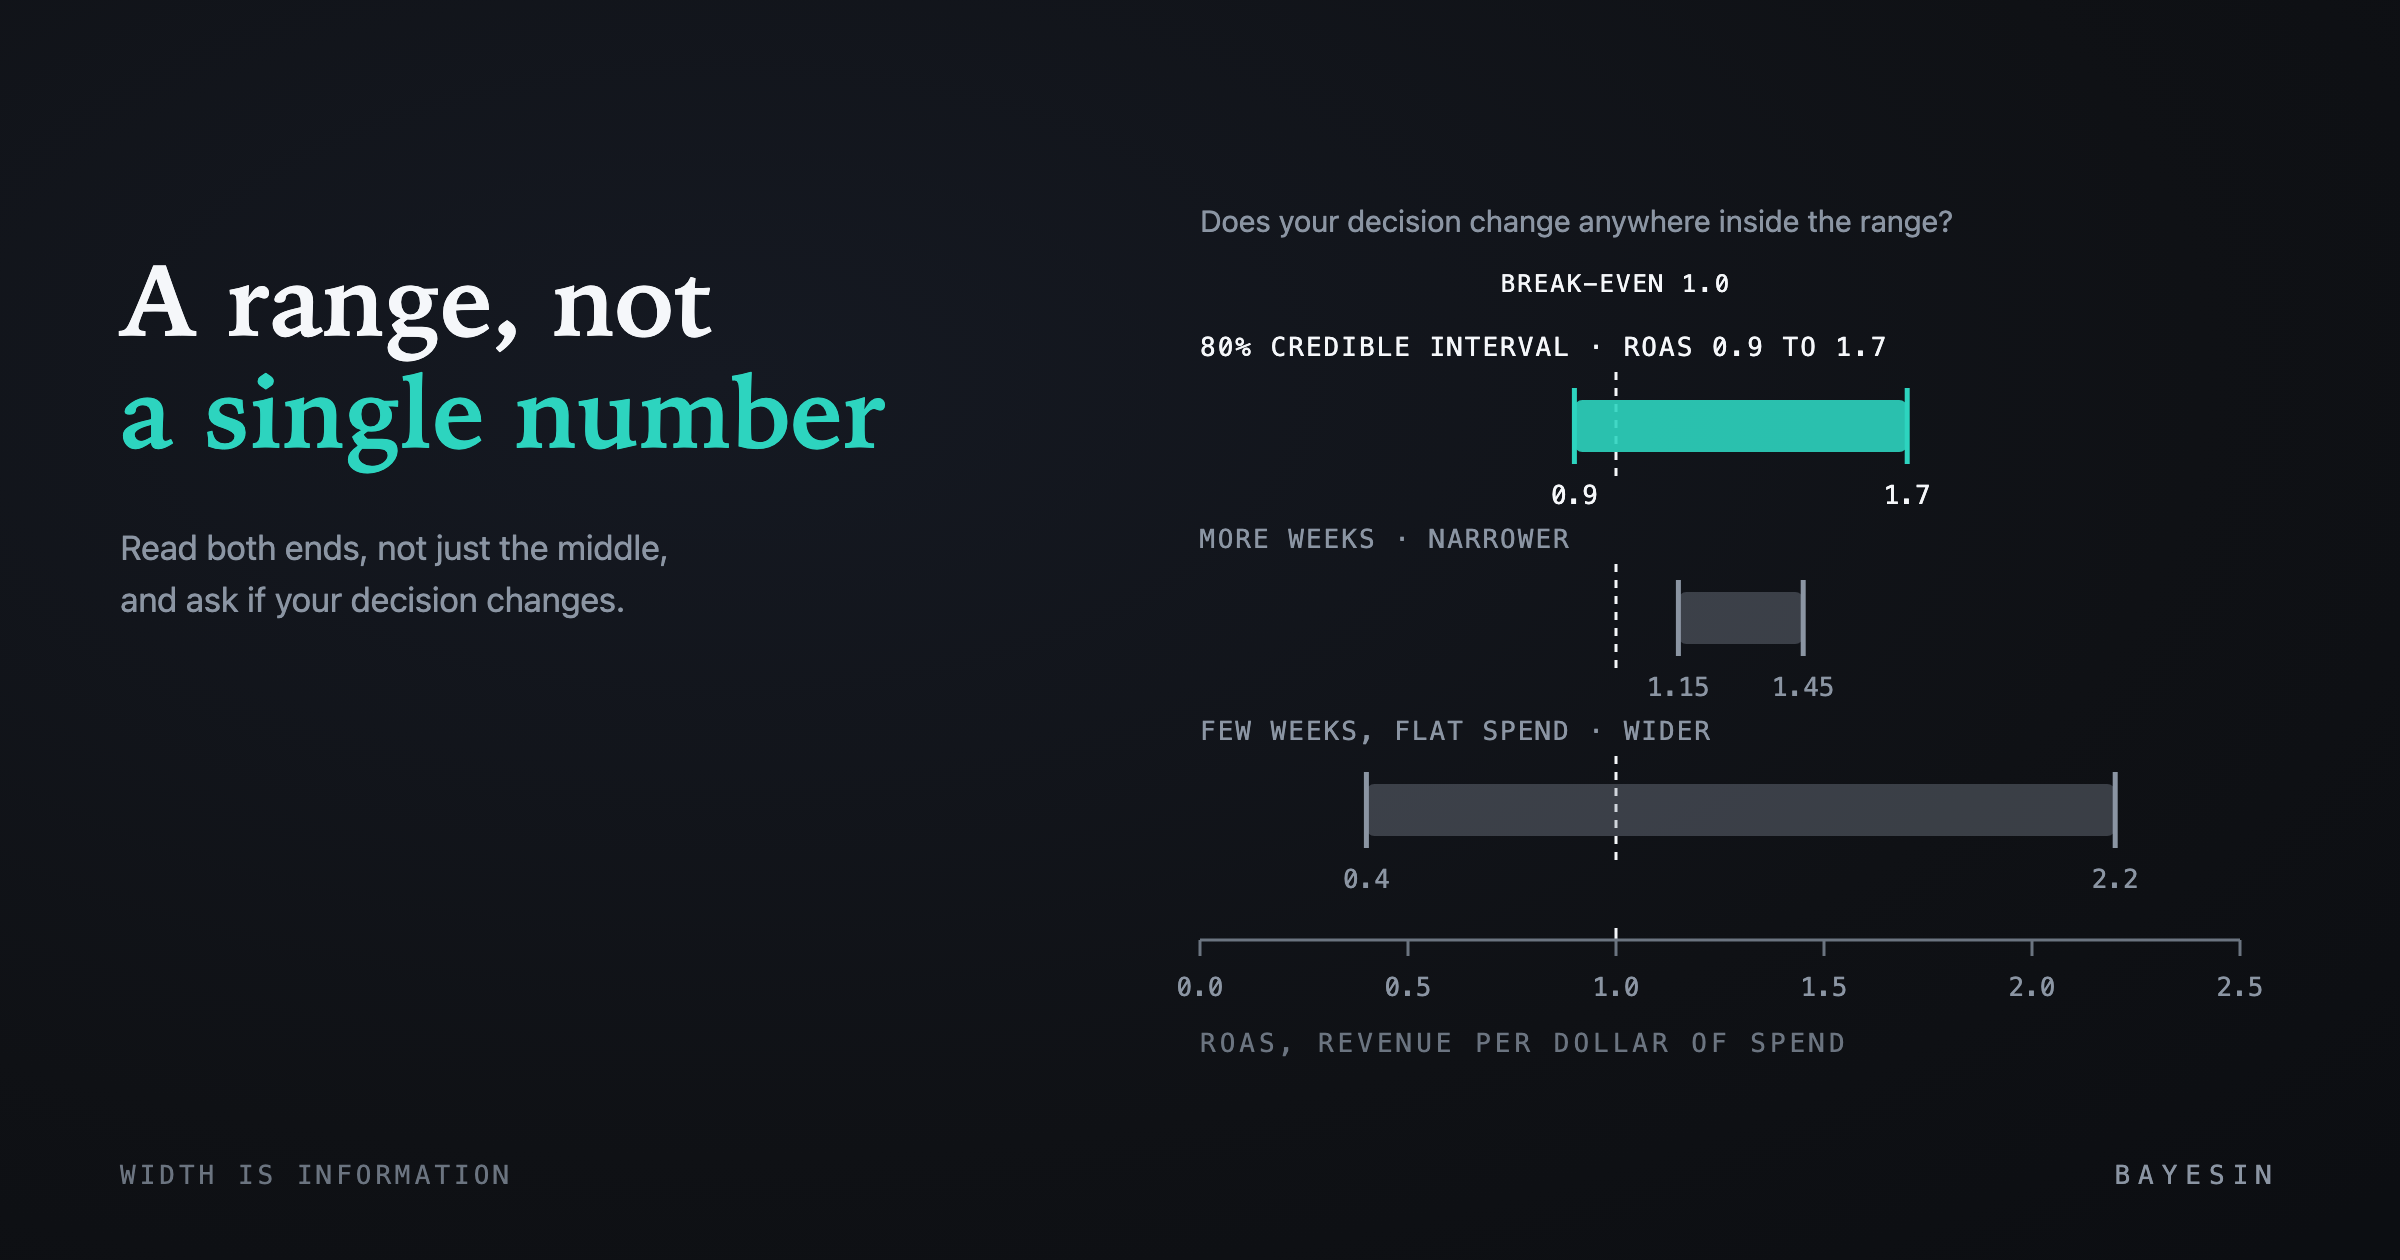
Consider a channel whose return on ad spend (ROAS) has an 80% credible interval from 0.9 to 1.7. The model is stating that there is roughly a four-in-five probability that the value lies in that range, given its assumptions and the data.
The phrase "given the model" carries weight, because the interval describes the model's uncertainty rather than every possible source of error. A misspecified model can therefore produce a tight range that is still wrong, a point I return to below.
Which interval the platform reports
Bayesin reports an 80% credible interval on each channel's ROAS, which is revenue attributed to the channel divided by its spend. The interval runs from the 10th to the 90th percentile of the posterior. It is computed from the model's draws of the channel's total contribution rather than from a single point estimate. The baseline share carries an 80% interval on the same basis.
Marginal return, the revenue from the next dollar, is a different quantity. The platform reads it as the slope of the fitted response curve and shows a single value. The intervals in this post are therefore intervals on ROAS. Where I describe a decision line below, I use the ROAS break-even of 1.0, meaning attributed revenue equals spend.
Credible interval versus confidence interval
A confidence interval answers a different question, because its guarantee concerns repeated sampling. Across many hypothetical repeats of the study, a stated share of such intervals would cover the true value. A credible interval instead describes this one analysis, given the model. A common mix-up is to read a confidence interval as if it were a credible one.
In 2016, Morey, Hoekstra, Rouder, Lee and Wagenmakers argued in Psychonomic Bulletin & Review that confidence intervals lack several properties people often assume. They do not necessarily indicate precision, identify plausible parameter values, or reflect the probability that the true value lies inside the interval.
For a marketer, the practical consequence is straightforward. Bayesian models produce credible intervals, and the natural reading, that the value probably lies in the range, fits them well. Check which kind of interval your tool reports before interpreting a range.
Four steps to read an interval
Ask four questions in order. Where is the middle, where are the ends, does the range cross a decision line, and is it narrow enough to act on? The order prevents you from anchoring on the midpoint, which is the least reliable part of the picture.
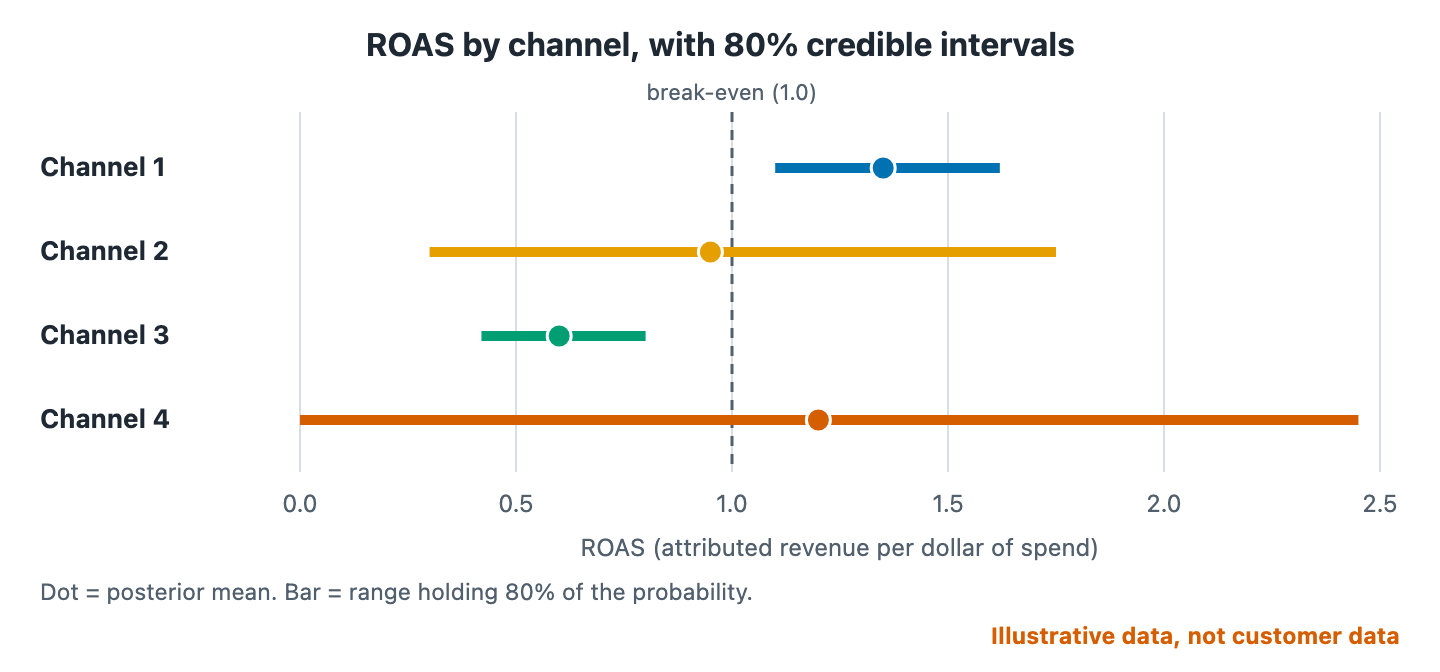
Figure 1. ROAS for four synthetic channels, with 80% credible intervals (10th to 90th percentile).
- Find the middle. The dot is the posterior mean, the model's single best summary, and it is only one point in the range.
- Read both ends. The bar shows where 80% of the probability sits, so the ends are the plausible best and worst cases.
- Compare with your decision line. For ROAS, a natural line is break-even at 1.0. Ask whether the interval sits wholly on one side.
- Judge the width. Compare the range with the size of the decision, since a range from 0.9 to 1.7 supports different moves than one from 1.3 to 1.4.
The table restates the figure so that you can check each reading against the numbers.
- Channel 1 — Mean ROAS: 1.35; 80% low: 1.10; 80% high: 1.62; Reading: Clear of 1.0 on the high side; the case to keep or add spend is fairly strong
- Channel 2 — Mean ROAS: 0.95; 80% low: 0.30; 80% high: 1.75; Reading: Straddles 1.0; the data cannot say whether more spend pays back
- Channel 3 — Mean ROAS: 0.60; 80% low: 0.42; 80% high: 0.80; Reading: Clear of 1.0 on the low side; the case to trim is fairly strong
- Channel 4 — Mean ROAS: 1.20; 80% low: 0.00; 80% high: 2.45; Reading: Very wide; the midpoint looks good, but I would not move budget on it alone
Channel 4 shows why the ends matter. Its midpoint is attractive, yet the range runs from near zero to almost two and a half, so the model has communicated very little.
What makes an interval wide
An interval becomes wide when the data carries little information about the quantity. The usual causes are a short history, spend that barely varies, or channels that rise and fall together. Each leaves the model unable to separate one effect from another.
Google's Meridian documentation is direct about this. Its diagnostics page says that when there is little information in the data, the prior and the posterior will be similar. A wide or prior-like result therefore means the data contributed little. The data-volume page suggests a practical test: run the model and evaluate the width of the credible intervals.
Two posts in this series cover the main causes. See how much data marketing mix modeling needs and why a channel with constant spend cannot be measured.
What to do when the interval is too wide to act on
Do not select the midpoint and proceed. Decide what would narrow the range, and whether the decision can wait or be made robust to it. A wide interval is a prompt to gather contrast rather than a reason to ignore the model.
The options run roughly from cheapest to most involved:
- Make a reversible move. Shift a small share of budget and watch the result, which limits the cost if the low end of the range is right.
- Add contrast. Vary spend on purpose for several weeks, so that the next fit has something to compare.
- Add weeks. More history narrows ranges over time, though not for channels that stay flat.
- Run an experiment. A holdout or lift test measures the channel directly and can anchor the next fit.
The consequence of ignoring width is documented in the research literature. In 2017, Jin and colleagues at Google showed that an optimal media mix from their model has large variance. The variance of the parameter estimates causes it, and a recommended allocation inherits the uncertainty of the numbers behind it.
Whether the interval level matters, 80% or 94%
The level matters, because a higher level means a wider range from the same posterior. A 94% interval is wider than an 80% interval, since it must hold more probability. Compare intervals only at the same level, and check which level your tool reports.
Conventions differ, and the PyMC-Marketing example notebook draws 94% and 50% highest density interval bands around its predictions, while the platform reports 80% intervals. Neither is more correct, because they answer slightly different questions.
An 80% interval leaves a one-in-five chance that the true value lies outside it. That chance is substantial, so treat the ends as a sensible planning range rather than as absolute limits.
A narrow interval does not mean the model is right
A narrow interval means the model is confident, given its own structure and assumptions, but it does not certify those assumptions. A model can be tightly wrong, for example when the history is too short to distinguish a yearly seasonal pattern from media.
That is why an interval is one check among several. In 2020, Gelman and colleagues described Bayesian workflow as covering model construction, evaluation, validation and comparison, with uncertainty spanning observations, parameters and model structure. Reading an interval is the last step, after the model has passed the earlier ones.
For the same reason, I argue that a model should be allowed to refuse. If the sampler has not settled or the baseline cannot be identified, the interval means little. The guide on when to distrust marketing mix model results explains where that line falls.
Quick answers on reading intervals
Is a credible interval the same as a margin of error?
Not quite. A margin of error usually comes from sampling theory and describes repeated surveys. A credible interval comes from the posterior and describes the model's belief about one quantity, given its assumptions. Both express uncertainty, but a correct interpretation is worded differently for each.
Should I plan for the low end or the high end?
Neither by default. Plan for the range: if a decision works across the whole interval, proceed. If it works only at one end, treat the move as a bet and prefer reversible steps. The interval shows which outcomes your plan must survive.
What if two channels' intervals overlap?
Overlap means the data cannot separate them with confidence, so you cannot conclude that one is better. Avoid a large reallocation between them on this evidence alone. A modest test move, or more contrast in spend, is a better next step than a bold one.
Why does a channel's interval change between refits?
New weeks change the data, and the interval updates with it. Ranges usually narrow with more informative weeks, though they can widen if new data conflicts with the old. A change is not a sign of error but of the model learning, and you can read it the same way.
Sources
- Morey, R. D., Hoekstra, R., Rouder, J. N., Lee, M. D. and Wagenmakers, E.-J., "The fallacy of placing confidence in confidence intervals," Psychonomic Bulletin & Review 23
- Jin, Y. et al., "Bayesian Methods for Media Mix Modeling with Carryover and Shape Effects," Google Research
- Gelman, A. et al., "Bayesian Workflow," arXiv
- Google for Developers, "Run model diagnostics," Meridian documentation
- Google for Developers, "Amount of data needed," Meridian documentation
- PyMC Labs, "Media Mix Model example notebook," PyMC-Marketing documentation
See it on your own rows.
Bayesin is pre-launch. Join the waitlist and we will reach out as access opens.
Get new posts by email.
New posts only. See privacy for what we keep.