MMM fundamentals
Marginal vs average ROAS: what ROAS by channel leaves out
Marginal vs average ROAS: a channel at $2.53 average return can have a $0.40 marginal return. See what ROAS by channel leaves out and what to add beside it.
Brandon Cade · Sep 27, 2026 · 8 min read
Key Takeaways
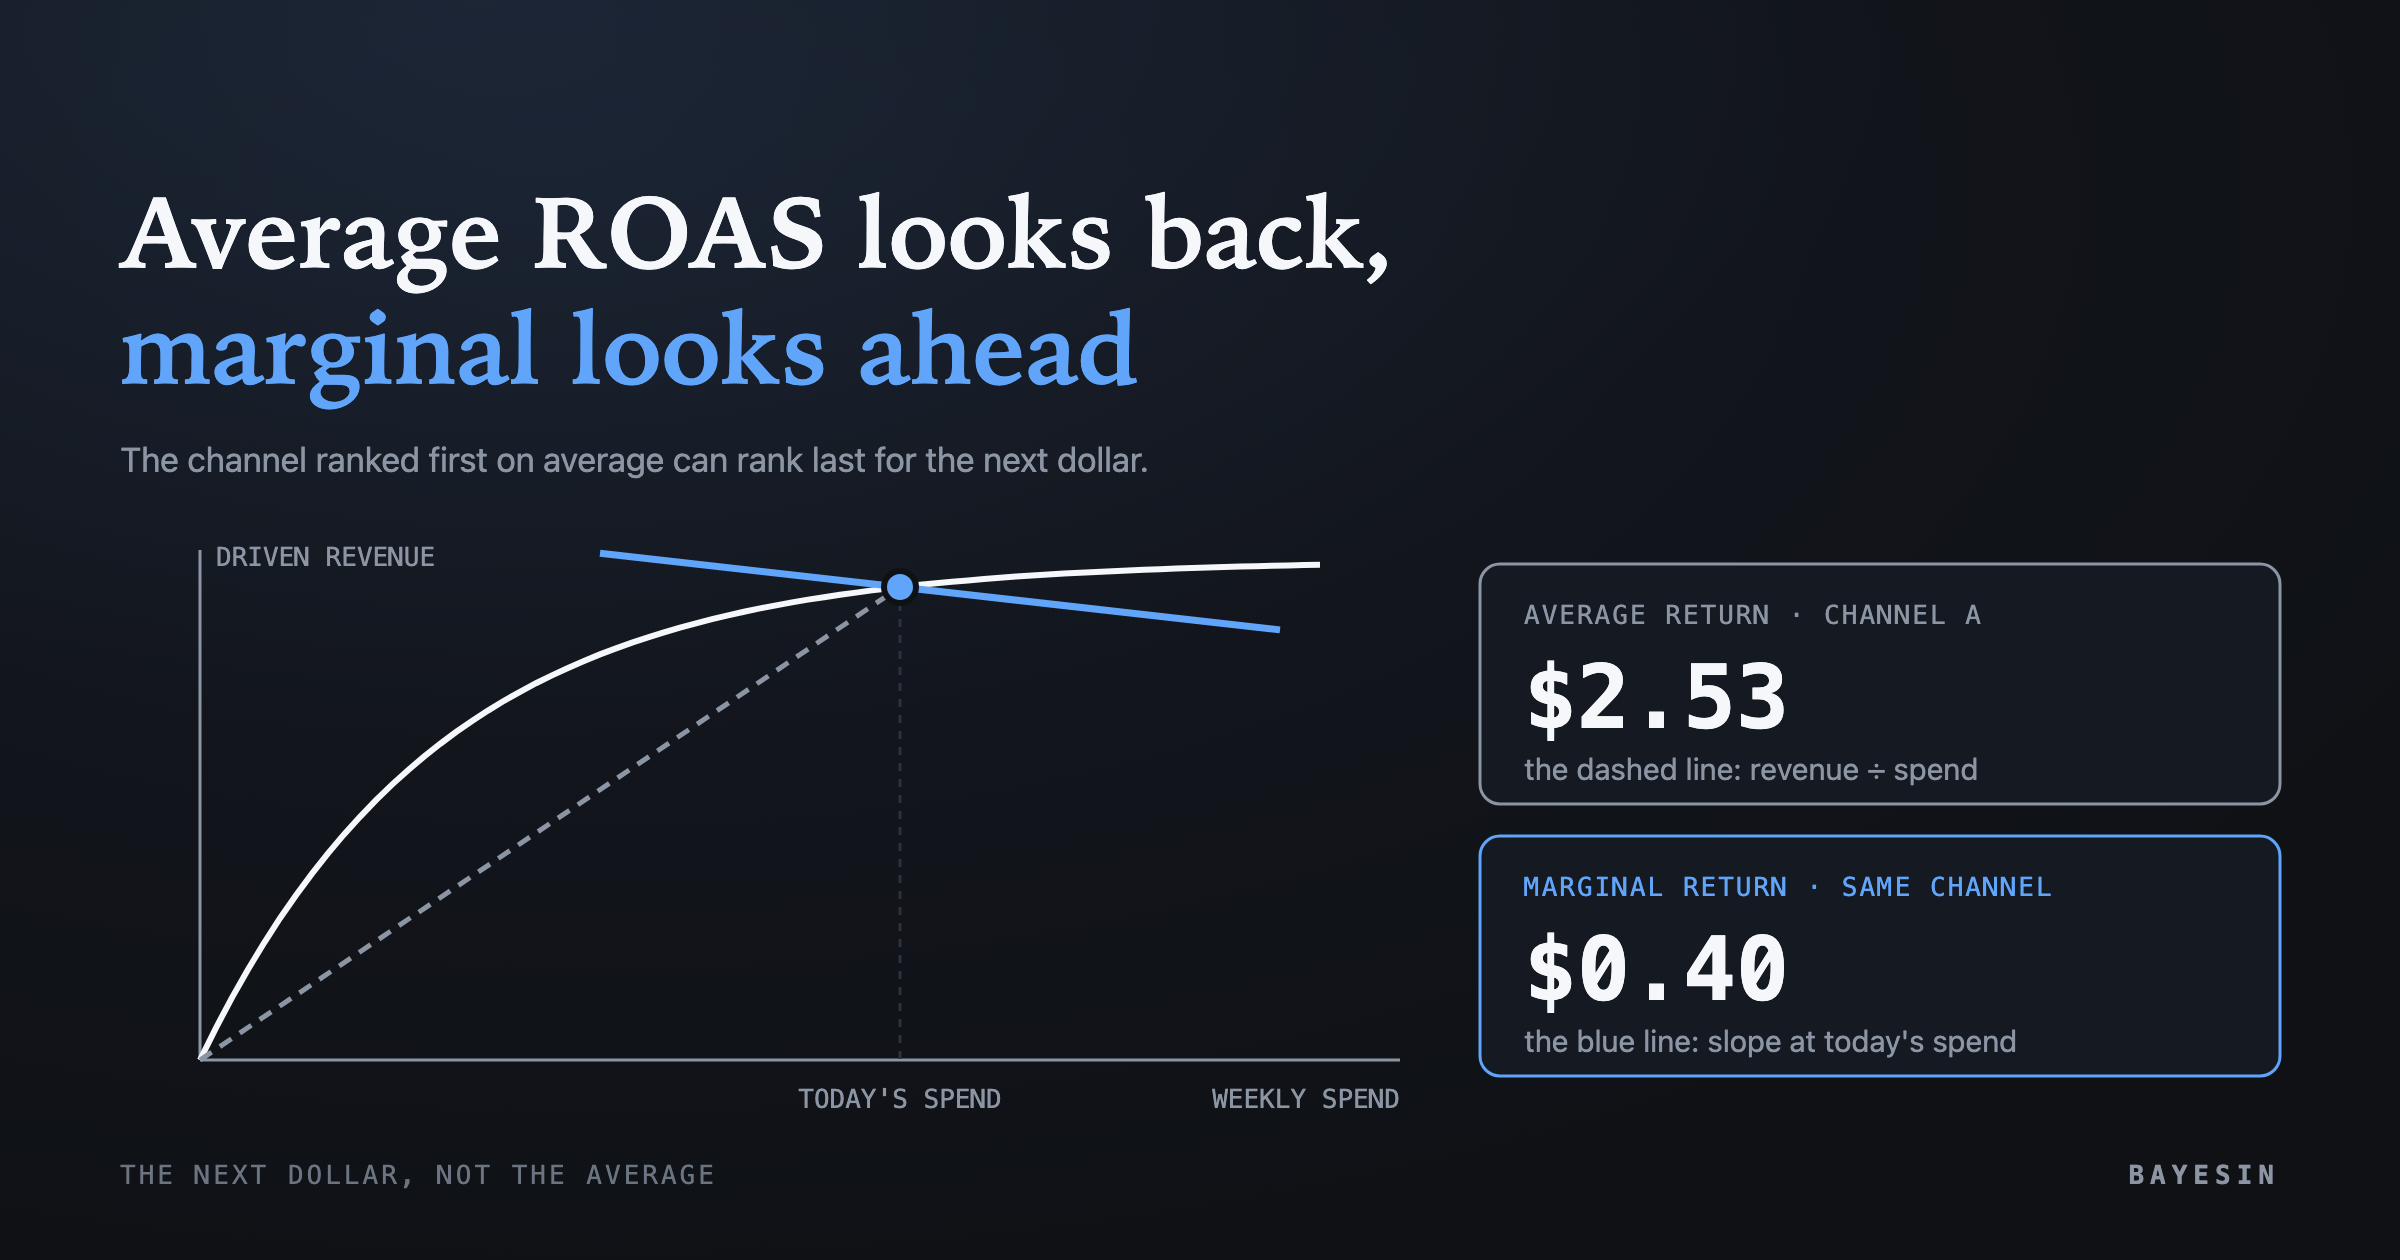
- Average return, often reported as ROAS, divides a channel's revenue by its spend. It looks backward and answers what the channel did.
- Marginal return is the revenue from the next dollar. It looks forward and answers what a budget move will do.
- A channel can rank first on average return and last on marginal return once it is on the flat part of its curve.
- Marginal return is a projection beyond past spend, so read it with its credible interval and move budget in small steps.
Most channel reports include a ratio: revenue divided by spend. It is a fair summary of the past. It answers a different question from the one a budget owner faces, which is where the next dollar should go. This piece separates marginal ROAS from average ROAS. This cluster calls them marginal return and average return, and the two can rank the same channels in opposite order.
What is average return, and what does it answer?
Average return is a channel's revenue divided by its spend over a period, and it is commonly called ROAS. It answers one question well: how did this channel do at the spend it had? It is a backward-looking grade and says nothing about what happens if the spend changes.
Google's Meridian documentation, as of 2026, defines ROI as the incremental outcome at your historical spend level divided by the spend. It calls this an overall grade for past channel effectiveness. I use "average return" for this ratio, with one caution: whether the numerator is all attributed revenue or only incremental revenue changes the answer.
Average return is useful. It reconciles to the ledger, and it shows which channels earned their keep. Where it falls short is as a guide to the next allocation.
Marginal ROAS vs average ROAS: marginal return is the slope
Marginal return is the revenue you expect from the next dollar of spend in a channel, which practitioners often call marginal ROAS. Geometrically, it is the slope of the channel's response curve at today's spend. Average return is the height of the curve divided by spend, and marginal return is the steepness of the curve at that point.
Meridian's documentation defines marginal ROI as the return on the next dollar spent above the historical budget level. It describes the contrast plainly: ROI is a backward-looking average, while marginal ROI is forward-looking and indicates current saturation. It adds that when marginal ROI is much lower than ROI, the channel is beginning to saturate at its historical spend.
That last sentence is the whole argument. A gap between the two numbers is a measurement of saturation, and I explain the curve behind it in adstock and saturation explained.
The gap runs one way only when a curve is concave, which is the common case. On an S-shaped curve, the early dollars can return more than the average, so marginal return can start above average return before it falls. Reading both numbers side by side shows which region a channel is in.
Three channels, two rankings: A leads on average and trails on marginal
The example below uses synthetic numbers, so they are illustrative and not real customer data. Three channels each follow a saturating response curve. The table lists each channel's weekly spend, average return and marginal return. I chose the curves so that the two rankings can disagree, which real data may or may not do.
- Channel A — Weekly spend: $150k; Average return: $2.53; Marginal return: $0.40
- Channel B — Weekly spend: $100k; Average return: $1.18; Marginal return: $0.91
- Channel C — Weekly spend: $60k; Average return: $1.13; Marginal return: $0.82
Ranked by average return, the order is A, then B, then C. Ranked by marginal return, it is B, then C, then A. Channel A is the strongest performer by the ratio and the weakest place for an added dollar.
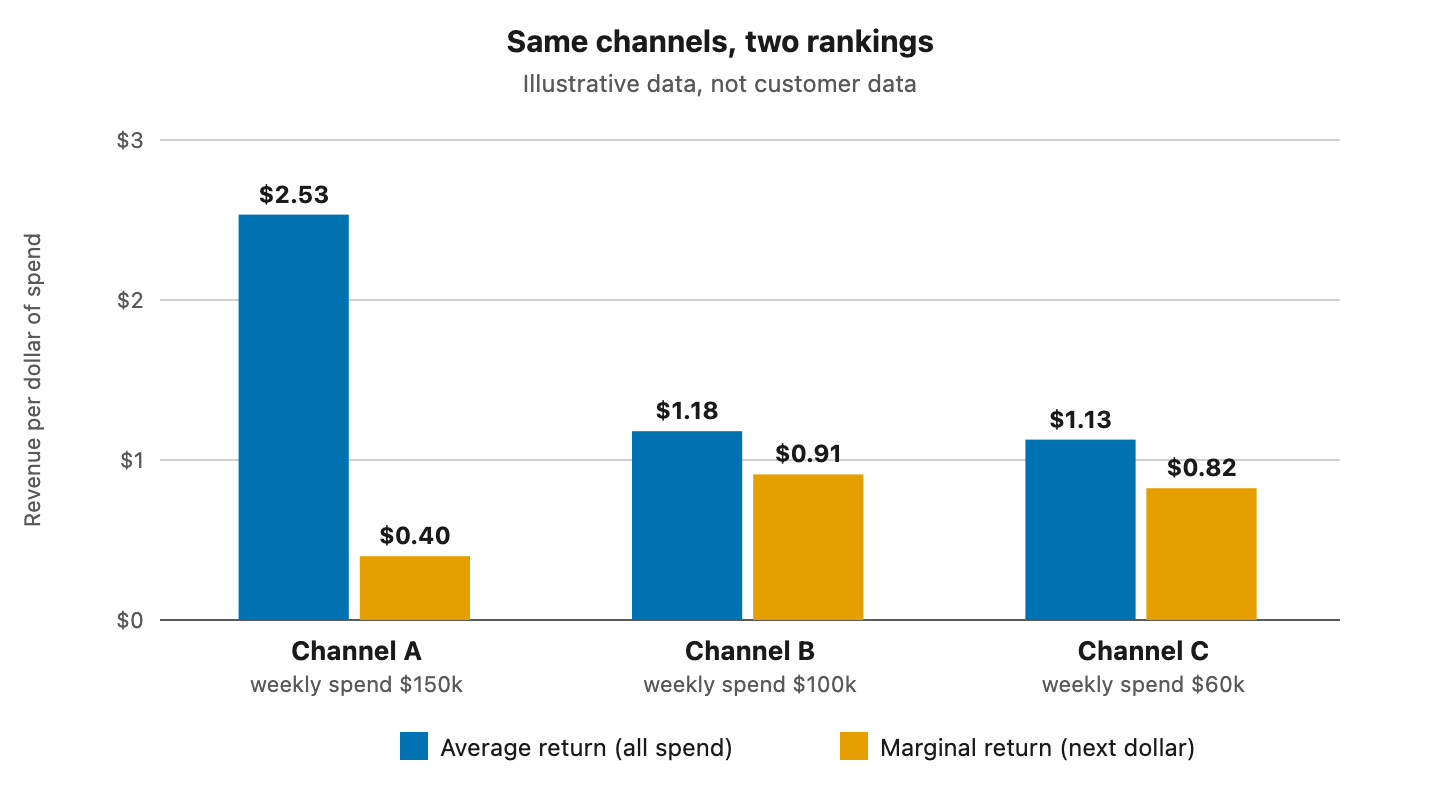
Figure 1. Average return and marginal return for three channels.
Consider a small move. Take $10k a week from Channel A and give it to Channel B. To a first approximation, A gives up about $4.0k of revenue (10 times $0.40) and B gains about $9.1k (10 times $0.91). The net is roughly $5.1k a week. The approximation holds only for small moves, because the curves bend as spend changes.
Nothing here says Channel A is a poor channel. Its early dollars did well, and its average return reflects those early dollars, while its next dollar does not.
The average keeps looking good for three reasons
The average blends every dollar ever spent, including the early ones that worked hardest. As spend grows, the newest dollars pull the average down only slowly. A saturated channel can therefore keep a strong average long after its marginal return has fallen.
A second reason is what the numerator contains. If revenue that would have arrived anyway is credited to a channel, the average looks better than the channel's true effect. A mix model separates that baseline demand from media, which is why the split matters, and I describe it in MMM baseline, seasonality and promotions.
A third reason is timing. Carryover means today's revenue includes earlier spend, so a period-by-period ratio can misplace credit across weeks, and adstock corrects that by letting spend carry forward. All three effects push the ratio away from the number a budget decision needs.
How much should you trust a marginal return?
Trust it as much as its credible interval allows, and less the further it sits from spend the data has seen. Marginal return is a projection. Meridian's documentation warns that estimating it requires extrapolating beyond historical spend levels, and that uncertainty grows the further spending moves from observed data.
The same caution appears in Meridian's note on saturation, where the estimate of the curve parameters rests on the observed range of media data. Results based on extrapolation deserve appropriate caution. If a channel has always sat between $50k and $80k a week, its behavior at $150k is a guess.
Data variation matters too. In 2017, Google researchers Yunting Sun and colleagues found that a geo-level model produced tighter credible intervals than national-level models. They said this can protect advertisers from unsound reallocation decisions. The Jin paper from the same year adds that a Bayesian posterior supports both return on ad spend and marginal return. Each can therefore carry an interval.
Channels that move together make the intervals wider still. Chan and Perry list correlated input variables among the challenges of media mix modeling, and the pillar guide gives that source. A ranking that hides the intervals overstates what is known.
Using marginal return in a budget conversation
Rank channels by marginal return, show the interval beside each, move small amounts between the top and bottom, and watch the next refit. That sequence keeps every step inside the range the model has seen, and you can confirm large moves with a test before committing.
Meridian's guidance is to prioritize channels with the highest marginal ROI when allocating additional budget. Meta's Robyn documentation describes a budget allocator that maximizes response for a given total budget, using nonlinear optimization with constraints.
In practice, I would ask four questions of any allocation proposal:
- Is the ranking by marginal return, and does each figure have an interval?
- Do the top two channels' intervals overlap, so that their order is unsettled?
- How far is the proposed spend from anything the data has seen?
- When is the next refit, and what would change my mind?
The last question is why models are refit on a schedule. A marginal return is a snapshot, and a moved budget changes the position on the curve. I cover that in how often to refit a marketing mix model.
What should you say when someone asks for the ROAS by channel?
Give them the average return, and add the marginal return beside it with its interval. The pair answers both questions: how each channel did, and where the next dollar should go. Framed that way, the conversation adds a number and does not replace one, so the average stays available for reconciliation.
You can reuse this line: "This is what the channel returned so far. This is what the next dollar is expected to return, and this is the range I would not be surprised by."
The pillar guide shows where both numbers come from inside a media mix model. If you would like the same ideas in shorter, plainer terms, start with Spend, revenue and ROAS: what each one is telling you.
Frequently asked questions
Is marginal ROAS the same as incremental ROAS?
No. Incremental return divides the revenue a channel caused by all of its spend, so it is still an average. Marginal return is the slope, the revenue caused by the next dollar. A channel can have a healthy incremental return and a low marginal return at the same time, as Channel A does above.
Should I cut the channel with the lowest average return?
Not on that number alone. A low average can hide a steep, unsaturated curve, and a high average can hide a flat one. Compare marginal returns with their intervals, and check how far the proposed move is from spend the model has seen. Then cut or add in small steps.
Can marginal return be measured directly?
Only with experiments. A holdout or lift test that changes spend by a known amount measures the return on that change. A media mix model estimates the slope from historical variation. When both are available, experiment results can serve as priors or as checks on the model.
Why does the ranking change after each refit?
New weeks add information, and moved budgets shift each channel along its curve. Both change marginal return. Ranking changes that stay inside the intervals are noise, and changes that leave them are signals. Comparing refits side by side is how you tell them apart.
Sources
- Google for Developers, "Incremental Outcome, ROI, mROI & Response Curves," Meridian documentation
- Google for Developers, "Media saturation and lagging," Meridian documentation
- Google for Developers, "Choose and configure treatment prior types," Meridian documentation
- Google Research, Jin, Wang, Sun, Chan and Koehler, "Bayesian Methods for Media Mix Modeling with Carryover and Shape Effects"
- Google Research, Sun, Wang, Jin, Chan and Koehler, "Geo-level Bayesian Hierarchical Media Mix Modeling"
- Google Research, Chan and Perry, "Challenges and Opportunities in Media Mix Modeling"
- Meta, "Key Features," Robyn documentation
See it on your own rows.
Bayesin is pre-launch. Join the waitlist and we will reach out as access opens.
Get new posts by email.
New posts only. See privacy for what we keep.