MMM fundamentals
MMM baseline, seasonality and promotions explained
MMM baseline and seasonality explained: how a model splits revenue into four layers, and how skipping one term lifts November media credit from 90 to 188.
Brandon Cade · Sep 25, 2026 · 8 min read
Key Takeaways
- A media mix model splits revenue into parts: baseline, seasonal movement, promotions and other non-media effects, and media. Only the media part is credited to channels.
- Baseline share is the portion of revenue the model attributes to everything that is not media. It is an estimate, and it should carry a credible interval.
- If seasonal or promotional lifts are not separated, they can be credited to whichever channel happened to rise with them.
- A yearly seasonal pattern needs more than one year of weekly history to estimate. Shorter history leaves it entangled with trend.
When people ask what a media mix model does, the short answer is that it divides revenue into causes. Media is one cause among several, and the rest is the demand that would have arrived anyway. That remainder is where most of the modeling care goes. This guide covers the MMM baseline, seasonality and promotion terms, the parts a model separates, and shows how you can check the split.
What does an MMM mean by baseline?
Baseline is the revenue the model expects if marketing spend were at its baseline level, which is usually zero. It captures brand strength, distribution, competitor activity, word of mouth and every other force that does not come from the media you are modeling. Baseline share is baseline as a percentage of total revenue.
Google's Meridian documentation gives the formal definition. As of 2026, it says control variables help estimate baseline outcome. That is the expected outcome in the counterfactual where each treatment variable sits at its baseline value.
I use "baseline share" for the percentage version throughout this cluster. Because it is an estimate, it should be reported as a credible interval and not as a single figure. A baseline share of 70% with an interval from 60% to 80% is a different statement from a bare 70%.
MMM baseline and seasonality: how the calendar enters the model
Seasonality terms capture regular movement in revenue that follows the calendar: the holiday peak, the summer lull, the back-to-school rise. Your media does not cause these movements, but it often follows them. A model that cannot see them may credit that movement to media instead.
Tools handle this in different ways. Meta's Robyn documentation says it provides trend, season, holiday and weekday decomposition using Prophet, with the stated aim of reducing human bias. It contrasts this with conventional MMM, where such effects are often entered by hand as a linear trend or a dummy variable for seasonality.
Meridian takes another route. Its model specification includes time-varying intercepts that contribute a trend and seasonality component, defined by knots at points in time. For models with several geographies, the default places a knot at each time point. For a single national series, the default is one knot, which acts as a common intercept across all periods.
The designs differ, but the aim is the same: give revenue a way to move with the calendar without paying media for it.
How are promotions and other non-media effects handled?
Promotions and other non-media events are usually entered as control variables or as their own terms. Their job is to soak up lifts that would otherwise be credited to media. This matters most when a promotion and a spend increase land in the same week, which is common.
Meridian's control-variable documentation is direct about the logic. It says confounders, meaning variables that affect both the treatments and the outcome, should be included to debias causal estimates. It recommends focusing on variables that influenced actual marketing decisions. It also suggests asking managers about spend spikes tied to events such as holidays or product launches.
It also states a limit. The regression effects of control variables cannot be interpreted as causal effects, so Meridian does not report contribution percentages for them. A control can clean up the media estimate without itself being a trustworthy causal figure.
What each layer captures, and how tools handle it
The table summarizes the four layers a model separates. It compares what each project's public documentation describes and does not rank the tools.
- Baseline — What it captures: Revenue expected with media at its baseline level: brand, distribution, competitors, word of mouth; How tools handle it: Meridian: control variables help estimate the baseline outcome; the estimate is a counterfactual
- Seasonality — What it captures: Regular calendar movement such as holiday peaks and summer lulls; How tools handle it: Robyn: Prophet decomposes trend, season, holiday and weekday. Meridian: time-varying intercepts with knots
- Promotions and controls — What it captures: One-off lifts and confounders that move both spend and revenue; How tools handle it: Entered as control variables; Meridian reports no causal contribution share for them
- Media — What it captures: The remainder credited to channels after carryover and saturation; How tools handle it: Estimated per channel, ideally with a credible interval
Sources: Meridian "Control variables" and "Model specification"; Robyn "Key Features".
A separated year: why skipping one term doubles November's media credit
This synthetic example is illustrative and not real customer data. Imagine twelve months of weekly revenue, averaged by month. It is built from four layers: a slowly rising baseline, a winter-peaking seasonal lift, two promotions, and media. Each layer is a sum you can inspect month by month.
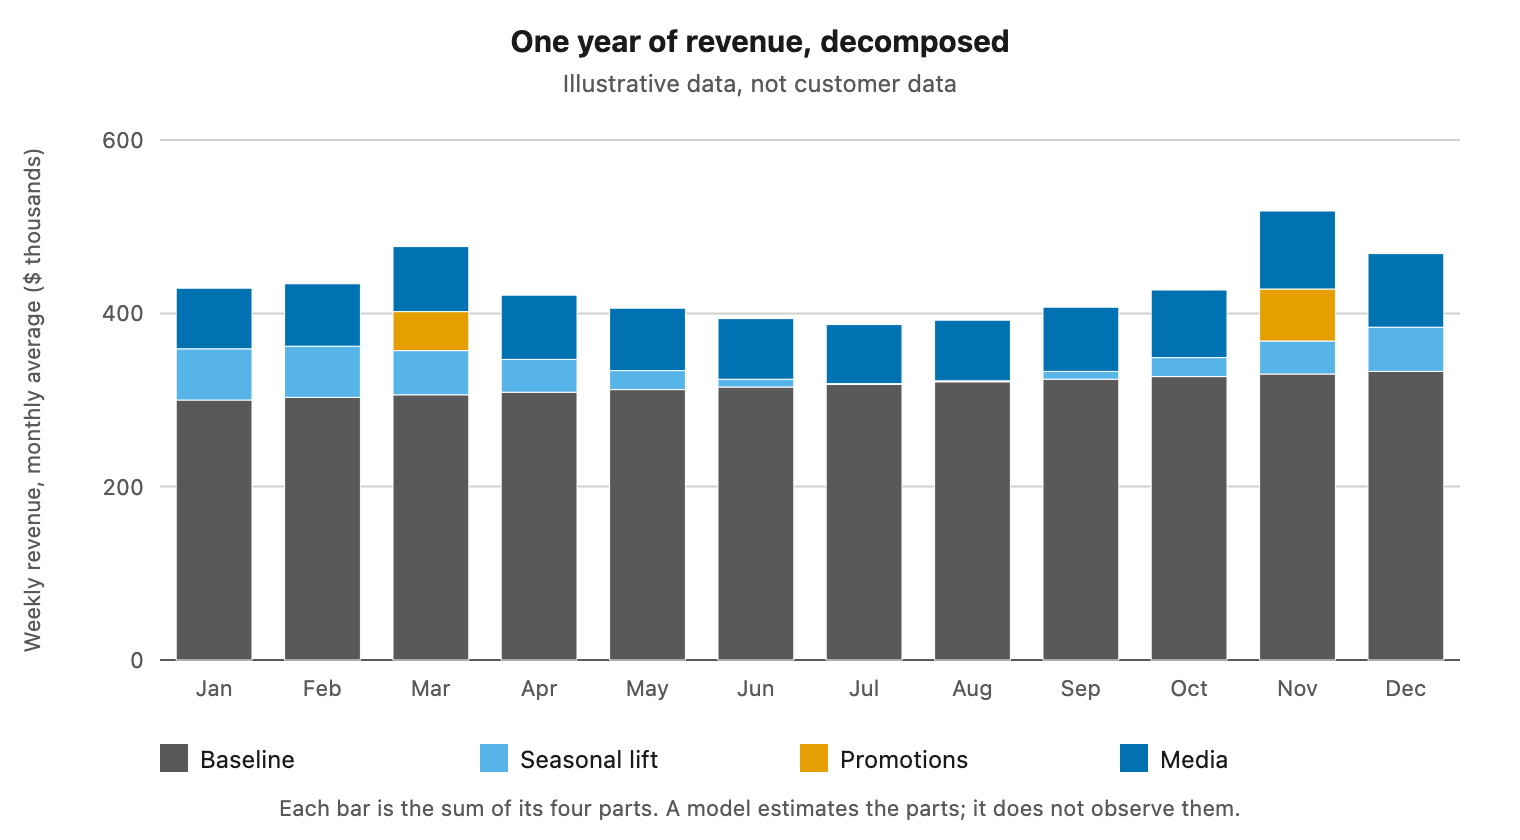
Figure 1. A revenue series split into baseline, seasonal lift, promotions and media.
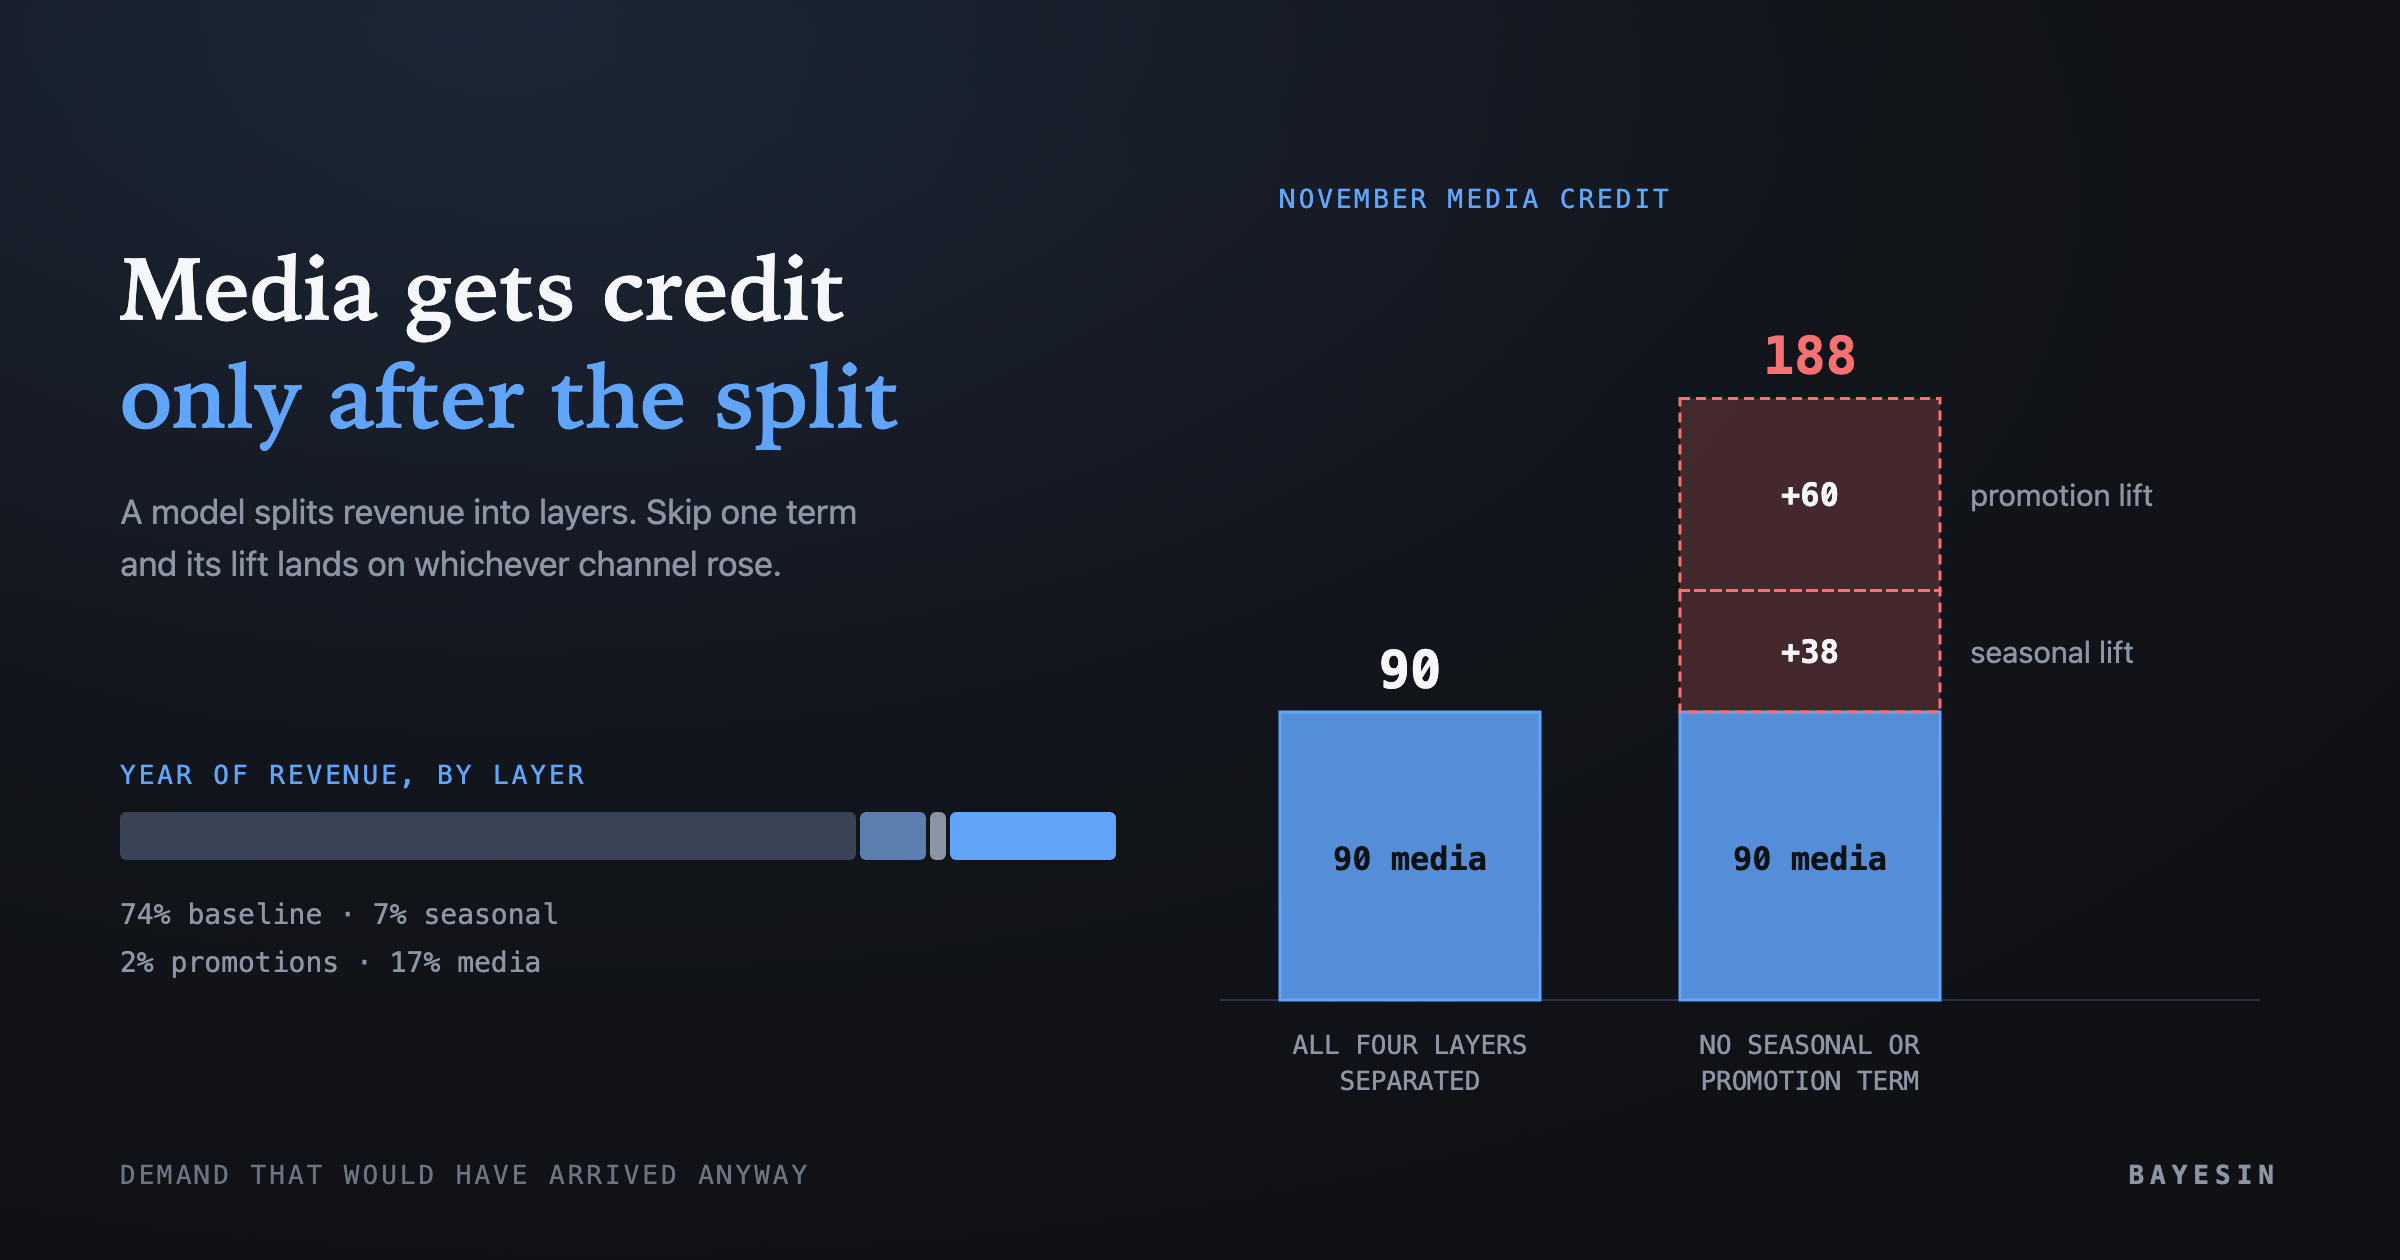
Over the year, the baseline layer is about 74% of revenue. Seasonal lift is about 7%, promotions about 2%, and media about 17%. November is the interesting month. Revenue is highest, media spend is also highest, and a seasonal lift and a promotion land in the same weeks.
Now suppose a model had no seasonal term and no promotion control. In November it would see revenue and media rise together. It would credit media with the seasonal lift of 38 and the promotion lift of 60. In this example that roughly doubles November's media contribution, from 90 to 188.
That inflated number then feeds a decision. The model might conclude that media is far more effective than it is and recommend more spend for next November. The separation protects the marginal return estimate, which I discuss in marginal ROAS vs average ROAS.
Why is history length so important for seasonality?
A yearly cycle is estimated by seeing it repeat, so you need at least one full year of weekly data, and more is better. With less than a year, the model never sees a complete cycle, and seasonality blends with trend and with any media that also trends.
Two 2017 Google papers describe the related difficulty. Chan and Perry list limited data and correlated inputs among the challenges of media mix modeling, and the pillar guide gives that source. Sun and colleagues describe national series as suffering from small sample size and insufficient variation in spend. They found that regional data gave tighter credible intervals.
The practical rule is to expect wide intervals on channel figures until you have well over a year of history. When a model must run on a short history, it should say so, and it should say what it left out. I cover how the interval behaves over time in how often to refit a marketing mix model.
How can you sanity-check a baseline share?
Ask whether the baseline share survives common sense, and then whether it survives a test. A very low baseline share implies that revenue would collapse without marketing. A very high one implies that media does almost nothing. Both can be true for a real business, but both deserve a second look before anyone acts.
Four checks work on any decomposition:
- If every channel went dark for a quarter, would revenue really fall by the amount the model implies?
- Does the seasonal shape match what you know of the calendar, with peaks in the weeks you expect?
- Do known promotions show up as lifts in the promotion layer and not in a channel?
- Does an experiment, such as a geo holdout, agree with the model's contribution for the channel it tested?
The fourth check is the strongest. In 2024, Google researchers Yingxiang Zhang and colleagues described how to bring experiment results into a Bayesian MMM through priors. They report in simulation that this substantially decreases bias and uncertainty. Robyn also supports calibrating with experiments.
Because the baseline is where a wrong split hides, a decomposition should show its assumptions. How different estimators expose those assumptions is the subject of Bayesian vs frequentist MMM.
Frequently asked questions
Is baseline the same as organic revenue?
Not exactly. Organic usually means revenue from unpaid channels, and your marketing can still drive it. Baseline is the model's estimate of revenue without the media it is modeling. It includes brand, distribution, competitor activity and demand, and it depends on which channels the model includes.
Do I have to supply promotion data?
It helps a great deal. A model cannot learn about a promotion it does not know occurred. If promotions coincide with spend changes, leaving them out invites the model to credit media with promotional lift. Dates and a simple flag are often enough to start with.
Can seasonality be estimated with less than a year of data?
Not reliably. The model has to see the cycle repeat to separate it from trend. With less history it can fit a curve, but that curve may be trend in disguise. A careful tool will say it left the seasonal term out and will not report an unidentified one.
What is a normal baseline share?
There is no universal figure, and it varies by business. What matters is whether your estimate has a credible interval and passes the checks above. Also watch whether it changes sharply between refits without a reason you can name, such as a new promotion calendar.
Sources
- Google for Developers, "Control variables," Meridian documentation
- Google for Developers, "Model specification," Meridian documentation
- Meta, "Key Features," Robyn documentation
- Google Research, Chan and Perry, "Challenges and Opportunities in Media Mix Modeling"
- Google Research, Sun, Wang, Jin, Chan and Koehler, "Geo-level Bayesian Hierarchical Media Mix Modeling"
- Google Research, Zhang et al., "Media Mix Model Calibration With Bayesian Priors"
See it on your own rows.
Bayesin is pre-launch. Join the waitlist and we will reach out as access opens.
Get new posts by email.
New posts only. See privacy for what we keep.