Trusting a model
How to check an AI analyst's marketing numbers
Published text-to-SQL scores don't tell you about your numbers. Here's a six-week synthetic dataset, twelve questions with known answers, and how to score it.
Brandon Cade · Nov 17, 2026 · 11 min read
Key Takeaways
- A public benchmark score says little about your tool on your data.
- Build a small dataset with known answers, including a missing week and a second currency.
- Ask twelve questions, and keep wrong numbers apart from declines.
- Even 11 of 12 correct leaves a range of 64.6% to 98.5%, so read the failures.
In the dataset below, Video's average weekly spend is 30.6 if a tool sees the missing week. It's 25.5 if the tool fills that week with a zero. Both look fine in a chart. That's the problem with checking a chat tool by eye, because it gives a clean answer whether or not the number is right.
This post gives you a small synthetic dataset with twelve questions and their right answers. You can run the check on any tool in about an hour. You'll also get a way to score it, plus what to look for in a tool's answer. The data is made up for this post, and it's not customer data.
What do published scores tell you?
That accuracy depends heavily on the setup. They don't say how a tool does on your data, your definitions or your questions.
Three benchmarks show the spread. The BIRD benchmark from 2023 reported 40.08% execution accuracy for ChatGPT on text-to-SQL, against 92.96% for humans, and that model is now dated. A 2026 preprint on semantic layers gave three frontier models 100 questions on a retail dataset. They scored 67.7% to 68.7% with a semantic document and 45.5% to 50.5% without one.
Marketing data has at least one public test. MetricNexus, a vendor, ran 193 questions over five seeded scenarios. Its direct-answer table lists eight models, from 13.0% to 66.4%. Three models also ran with code execution, reaching 44.3% to 93.5%, and one rose from 18.9% to 93.5%. The scoring is only partly documented, so read that as directional.
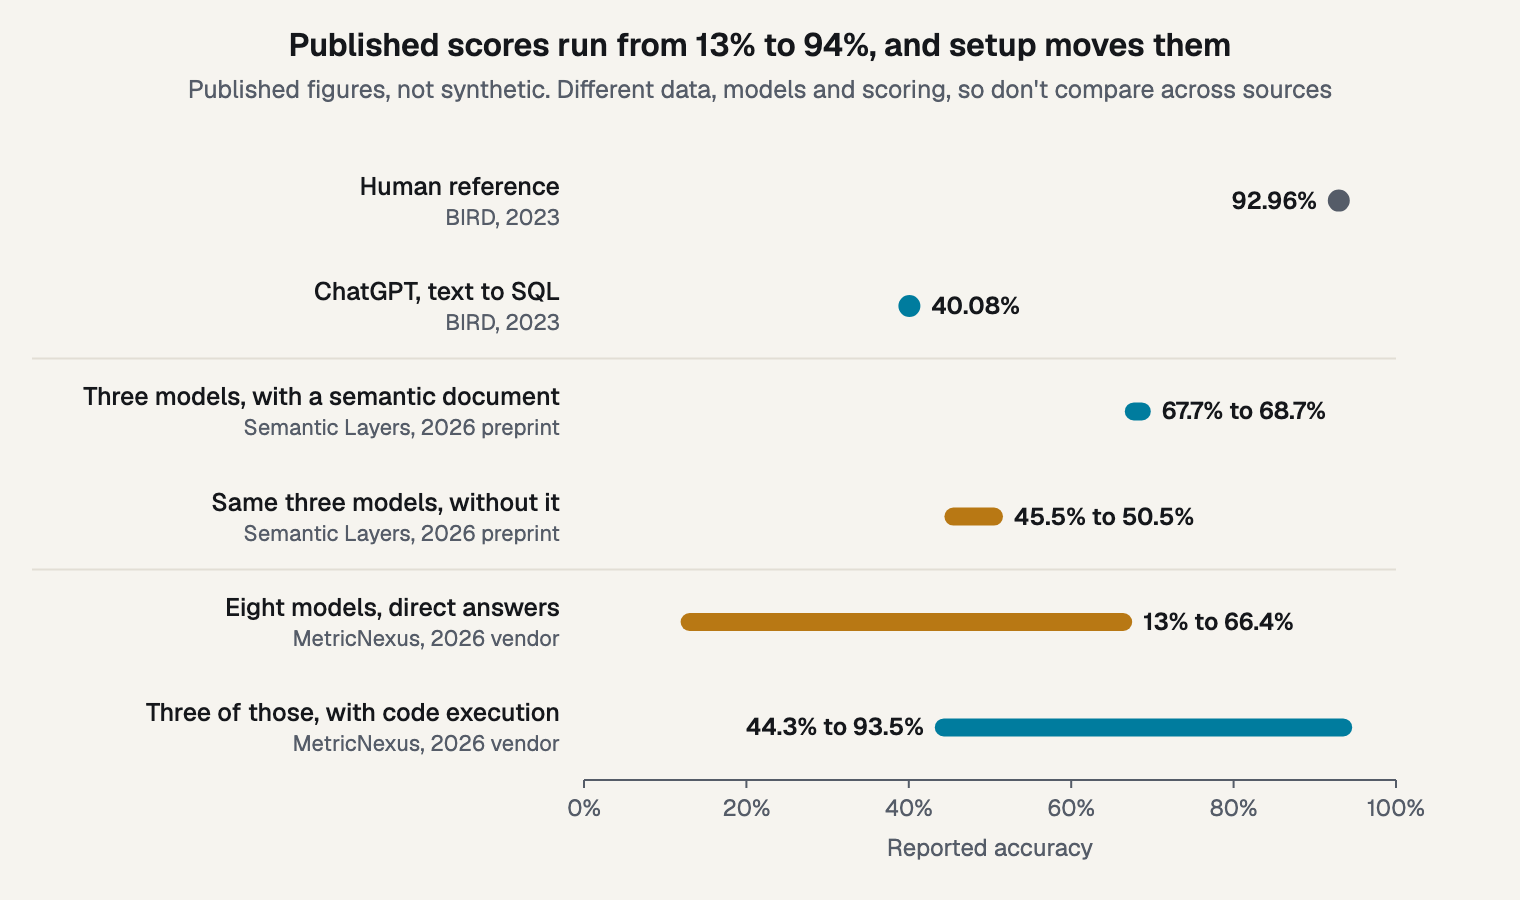
Figure 1. Published accuracy figures by setup. Published data, not synthetic. Different datasets, models and scoring, so don't compare across sources.
Those numbers come from different datasets and models, so they can't be ranked against each other. The useful comparison sits inside each study. The same three models gained 17 to 23 points from one document, and one model gained 74.6 points from running code. A score says as much about the setup as about the model, so your own setup is the thing to test.
How do errors happen?
Some are invented facts, and many are valid-looking queries that answer the wrong question. Those call for different checks, and the second kind is harder to catch.
NIST's 2024 generative AI profile calls the first kind confabulation: "confidently stated but erroneous or false content". A 2025 preprint from Kalai and colleagues offers one reason it persists. Training and testing can reward guessing over admitting uncertainty, so a tool can learn that a number scores better than a decline.
The second kind has been catalogued. NL2SQL-BUGs, a 2025 KDD paper, sorts semantic errors into 9 main categories and 31 subcategories across 2,018 annotated examples. Current models averaged 75.16% at detecting those errors. A 2026 preprint called GROUND names hallucinated metrics, invalid joins and wrong grain as the problems that limit production use.
You can't count on spotting these yourself. Databox, a vendor, reports a survey in which respondents reviewed an AI analysis with three planted errors, and 5% caught all three. It gives no sample size, so treat that as directional. It's still a good reason to hold the right answers before you ask.
How do you build the answer key?
Six weeks, four channels, one missing week, one other currency and a model table are enough to show most failures. Build it first, and work out every answer before you ask a tool anything.
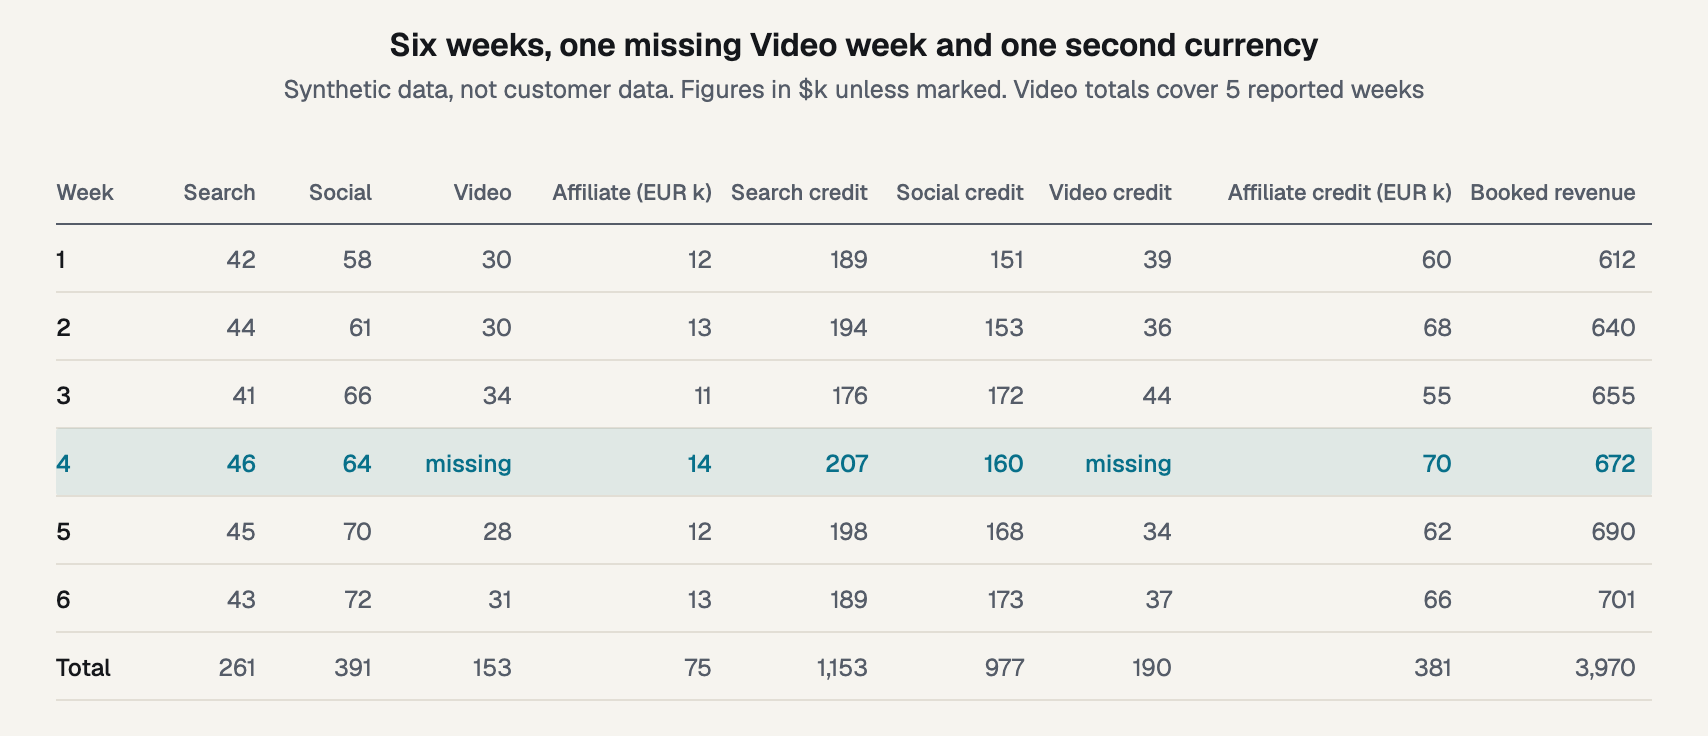
Figure 2. The six-week answer key. Synthetic data, not customer data.
Copy this into a file called marketing.csv. The empty cells in week 4 are deliberate.
week,search_spend_usd_k,social_spend_usd_k,video_spend_usd_k,affiliate_spend_eur_k,search_credit_usd_k,social_credit_usd_k,video_credit_usd_k,affiliate_credit_eur_k,booked_revenue_usd_k1,42,58,30,12,189,151,39,60,6122,44,61,30,13,194,153,36,68,6403,41,66,34,11,176,172,44,55,6554,46,64,,14,207,160,,70,6725,45,70,28,12,198,168,34,62,6906,43,72,31,13,189,173,37,66,701
Then add a second table of model output, which is also synthetic. Marginal return is the return on the next dollar, so it isn't the same thing as the average return you get from credit.
- Search: Marginal return: 0.55; 80% credible interval: 0.30 to 0.85
- Social: Marginal return: 1.10; 80% credible interval: 0.80 to 1.45
- Video: Marginal return: 1.25; 80% credible interval: 0.40 to 2.30
Each feature is there to catch one failure:
- The missing week shows whether a tool flags a gap or fills it.
- The euro column shows whether it adds currencies together.
- Credit next to booked revenue shows whether it treats two different quantities as one. I go through that in reconciling attribution to revenue.
- Affiliate's absence from the model shows whether it invents a figure for a channel the model never saw.
Credit-based return works out to 4.42 for Search, 2.50 for Social and 1.24 for Video over its 5 reported weeks. Affiliate's is 5.08, in euros on both sides.
To adapt the key, swap in your own column names and keep the traps. OWOX, a vendor, describes the real work as writing a reference query you'd stand behind for each question, and agreeing the pass mark before testing. I'd follow both. If you don't have a model yet, drop the model questions, and read is a media mix model worth it yet.
Which twelve questions should you ask?
Five test arithmetic and units, three test what the tool does when data isn't there, and four test whether it reads a model correctly. Ask each one in a new chat, so an earlier answer can't help the next.
Arithmetic and units
- Q2. Blended ROAS for Search and Social: Right answer: 2,130 / 652 = 3.27; Trap: 3.46, the mean of two ratios
- Q3. Booked revenue change, week 5 to 6: Right answer: +1.6%. Over six weeks it's +14.5%; Trap: Mixing the two periods
- Q4. Total spend, all channels: Right answer: $805k plus EUR 75k, with no total unless given a rate; Trap: 880
- Q7. Credit as a share of booked revenue: Right answer: 2,320 / 3,970 = 58.4% in dollars. It notes that Affiliate is left out and credit isn't revenue; Trap: 68.0%, from adding euro credit
- Q12. Ask Q2 three times in new chats: Right answer: 3.27 every time; Trap: Different figures
Q2 is the trap I'd expect to catch most people too. Averaging two ROAS figures feels natural, but it weights a small channel as heavily as a big one. Q12 needs a caveat. Anthropic's guidance suggests repeating a prompt and comparing outputs, because inconsistency can signal an error. It also says these methods don't eliminate errors. A tool can give 3.46 three times.
When the data isn't there
- Q1. Average weekly Video spend: Right answer: 30.6 over 5 reported weeks, and it flags week 4; Trap: 25.5, from a zero fill
- Q9. What's TikTok's ROAS?: Right answer: Not in the data; Trap: Any number
- Q10. What was last quarter's revenue?: Right answer: Only six weeks are available; Trap: Any number
These are the questions I'd weigh most heavily. A wrong number in Q9 or Q10 means the tool will answer without data, and that behavior won't stay inside a test.
Reading a model
- Q5. Where should the next dollar go?: Right answer: Search has the highest average return of the modeled channels and the lowest marginal return estimate. Social and Video ranges overlap, so they aren't separated; Trap: "Search", from ROAS
- Q6. How much revenue did Search cause?: Right answer: Credit isn't cause, and it points to the model; Trap: 1,153 as caused
- Q8. What happens if I triple Video?: Right answer: 93 against a range of 28 to 34, up to 2.7 times the highest seen. It warns about extrapolation; Trap: One number, no warning
- Q11. What does the 80% interval on Social mean?: Right answer: Under the model's assumptions, 80% of the probability for this return lies in that range; Trap: "80% chance the model is right"
Q5 is the most tempting trap, since a return of 4.42 looks like the obvious place to spend. Marginal against average ROAS explains why it isn't. Affiliate's 5.08 is higher, but it's in euros and outside the model, so a good answer says the model can't speak to it.
A good answer also stays modest about the ranges. Overlap is only a reading aid, and the proper check is the posterior of the difference, which this table doesn't have. Search's range nearly clears Social's, touching it only from 0.80 to 0.85, and it overlaps Video's by much more. So a tool should say the estimate favors Social or Video over Search, and that it can't rank those two.
The other three each have a post or a paper behind them. For Q6, what credit can't tell you separates credit from cause, and marketing incrementality testing is how you'd measure it. For Q8, Chan and Perry at Google noted in 2017 that limited ranges in the data make extrapolation hard. For Q11, see reading a credible interval.
How do you score it?
Use four classes, keep wrong numbers apart and set a pass mark first. Then read the failures, because the score itself won't tell you much.
- Correct. The right figure, with any flag the key asks for. On Q9 and Q10, saying the data isn't there is the correct answer.
- Wrong number. A figure that doesn't match the key. This is the class that matters most.
- Error. The tool fails or returns nothing usable.
- Declined. It says it can't answer a question the data does answer. That costs you time, but it can't end up in a budget deck.
Now read the score at its real precision. I used the Wilson formula from the NIST handbook for a 95% range, which is a frequentist interval, so it isn't a credible interval. In this calculation, 11 of 12 runs 64.6% to 98.5% and 23 of 25 runs 75.0% to 97.8%. A clean 12 of 12 still only reaches down to 75.8%.
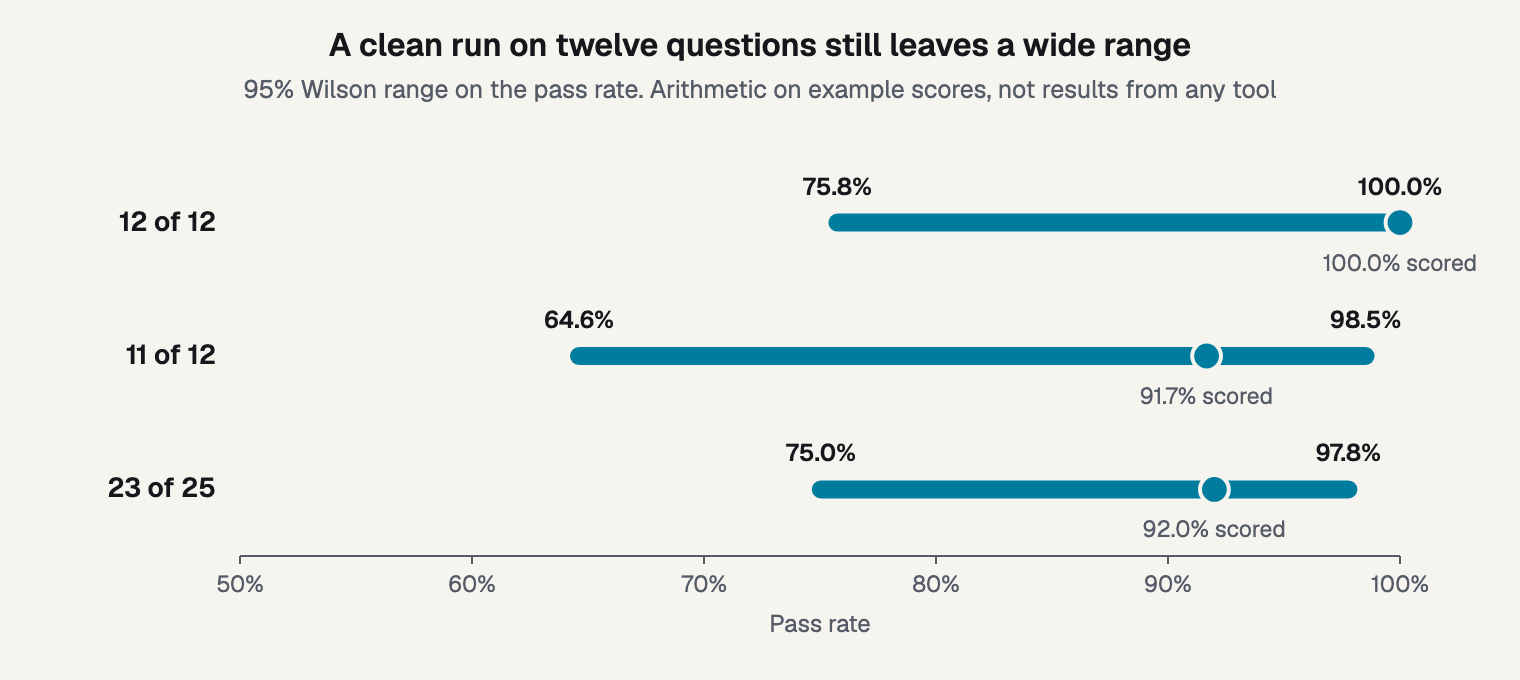
Figure 3. What a small check can and can't say about a pass rate. Arithmetic on example scores, not results from any tool.
One question here moves the score by 8.3 points. OWOX makes the same point about 25 questions: each is worth four points, so that test can't separate 90% from 94%.
Those ranges are also generous. Wilson assumes a random sample of questions, and these twelve were chosen to trip a tool up, so no score here estimates its everyday accuracy. A clean run shows that it avoided these traps. It doesn't show that the tool is right on your data, which is why I'd add your own questions once this runs.
Rerun the whole check after any model or schema change, since a score from before the change no longer describes the tool.
What should a good tool show you?
Where each number came from, what it calculated and what it couldn't answer. If you can see those three things, you can check any answer without rerunning the whole key.
Arithmetic is the easiest place to start. PAL, a 2022 method paper, has the language model write a program and hands the solving to an interpreter. That fits the MetricNexus jump above. GROUND adds checks on generated SQL before it runs. It reports that those enforced checks held, while judgment-dependent behavior, such as refusing an undefined metric, stayed fallible. So Q9 and Q10 stay useful even for a tool with strong guardrails.
Here's one example, using the product I work on. These are behaviors stated on the page for how Bayesin Analyst shows its work, not results.
- Q1, Q9, Q10: If a figure isn't available, the analyst says why, and it never fills the gap with a zero
- Q2: New numbers are calculated by Bayesin from figures already in the answer
- Q4: Currencies are never mixed
- Q5, Q11: Where the model gives a range, the answer gives it too
- Q6: Attribution credit is labeled as non-causal
I'm not reporting a score for it, and you shouldn't take the page's word over your own run. Put the key to Bayesin Analyst the way you would any other tool. It reads and calculates, and it never changes your data, models or campaigns. Bayesin never changes spend.
Frequently asked questions
Which tool is most accurate?
I don't know, and published scores don't settle it, because datasets, models and scoring all differ. Tools also change quickly, so a ranking ages fast. Run the twelve questions on the tools you're considering, using the same data, and compare the failure types and not only the totals.
Is declining a failure?
Not when the data isn't there. On Q9 and Q10, declining is the right answer. On a question the data does answer, count it as declined and keep it apart from wrong numbers. A decline costs you a few minutes, while a wrong number can reach a budget meeting unnoticed.
How often should I rerun it?
After any change to the tool's model, your schema or your metric definitions, and on a regular schedule if the tool updates without notice. Keep each run's answers and classes in one sheet. That makes it easy to spot a question that used to pass and now fails.
Can I use my own data?
Yes, once you hold reference answers you'd stand behind, worked out before you ask. Keep the traps by adding a missing period, a second currency and a channel the data doesn't have. Using your own warehouse also tests your definitions, which a synthetic set can't do.
What to do next
Copy the CSV and the model table, and work out the key yourself so you trust it. Agree a pass mark, then run all twelve questions on the tool you use now, and write down the class for each one.
Sources
- NeurIPS, "Can LLM Already Serve as A Database Interface? A BIg Bench for Large-Scale Database Grounded Text-to-SQLs," Li et al., 2023
- arXiv preprint, "Semantic Layers for Reliable LLM-Powered Data Analytics: A Paired Benchmark of Accuracy and Hallucination Across Three Frontier Models," Rumiantsau and Fokeev, 2026
- NIST, "NIST AI 600-1, Artificial Intelligence Risk Management Framework: Generative Artificial Intelligence Profile", 2024
- arXiv preprint, "Why Language Models Hallucinate," Kalai, Nachum, Vempala and Zhang, 2025
- KDD, "NL2SQL-BUGs: A Benchmark for Detecting Semantic Errors in NL2SQL Translation", 2025
- arXiv preprint, "GROUND: Reducing Hallucinations in LLM-Based Enterprise Analytics Through Governed Semantic Definitions", 2026
- arXiv, "PAL: Program-aided Language Models," Gao et al., 2022
- Anthropic, "Reduce hallucinations," documentation
- NIST/SEMATECH, "7.2.4.1. Confidence intervals," e-Handbook of Statistical Methods
- Google, "Challenges And Opportunities In Media Mix Modeling," Chan and Perry, 2017
- OWOX, "Text-to-SQL Accuracy: What a Benchmark Score Tells You About Your Own Warehouse," vendor guide, 2026
- MetricNexus, "Most LLMs Can't Calculate Your CPA. We Tested 10 To Prove It.," vendor benchmark, 2026
- Databox, "Marketing Root Cause Analysis: Using AI to Diagnose Why Performance Dropped (and What It Leaves Out)," vendor guide
See it on your own rows.
Bayesin is pre-launch. Join the waitlist and we will reach out as access opens.
Get new posts by email.
New posts only. See privacy for what we keep.