Hard-to-measure channels
Measuring Meta after the attribution changes
Meta narrowed click-through attribution in 2026, so reported numbers moved. See the bridge, why old incrementality factors break, and how to test the effect.
Brandon Cade · Nov 13, 2026 · 11 min read
Key Takeaways
- Meta's click-through column now counts link clicks only, so reported conversions can fall with no change in effect.
- In my synthetic bridge, click-through falls 18.0% and an old factor misses by the same 18.0%.
- Settings also inform delivery, so effect could move too.
- Only a test separates them.
In 2026, Meta changed what its click-through column counts, so reported numbers can move with no change in your ads. The useful question is what else moved. The answer shapes which factors you keep, which priors you rebuild and whether you change the budget.
This post has a bridge from Meta's old definitions to its new ones, built on one synthetic month. It shows how far a report can move by itself and why factors built before the change stop working. It also shows what would tell you that the effect moved as well. Meta can change its pages at any time, so check the current version before you rely on any quote here. Nothing in the bridge is customer data.
What did Meta change?
Click-through narrowed to link clicks, and engage-through took the other clicks for one day. In its March 2026 announcement, Meta said it was "changing the definition of click-through attribution for website and in-store conversions" to "exclusively include link clicks."
Conversions after "a share, save, or other non-link click actions" moved out. Engaged-view was renamed engage-through attribution, and the video threshold fell from 10 seconds to 5. Meta said the changes would "begin later this month" for campaigns optimizing for website or in-store conversions.
Meta's attribution help page now gives three windows:
- Click-through: "within 1-day or 7-day after a link click".
- Engage-through: "within 1-day after a non-link click action".
- View-through: "within 1-day after an impression".
Two other lines matter. Meta says there "will be no change to how advertisers are billed," and it hopes the definition "will significantly reduce measurement misalignment" with third-party tools. Rollout was also staged, since "Some accounts may still use prior versions" while it reaches everyone.
A separate API change came earlier. Meta's October 2025 developer post said the 7d_view and 28d_view attribution windows "will no longer be returned" from January 12, 2026. That's a change to your data feed, and it's worth checking on its own. I've covered why platform numbers differ from revenue elsewhere, and this adds one more reason.
How far can the number move with no change in effect?
In this example, click-through falls 18.0% and the setting total falls 5.2%, with incremental conversions held fixed. Here's one synthetic month with $310,000 of spend, where each conversion sits in exactly one bucket.
- Link click within 7 days: Conversions: 3,100; Old column: Click-through; New column: Click-through
- Non-link click, day 1: Conversions: 420; Old column: Click-through; New column: Engage-through
- Non-link click, days 2 to 7: Conversions: 260; Old column: Click-through; New column: Not counted
- Video watched 10+ seconds, within 1 day: Conversions: 290; Old column: Engaged-view; New column: Engage-through
- Video watched 5 to 9 seconds, within 1 day: Conversions: 310; Old column: View-through; New column: Engage-through
- Impression only, within 1 day: Conversions: 590; Old column: View-through; New column: View-through
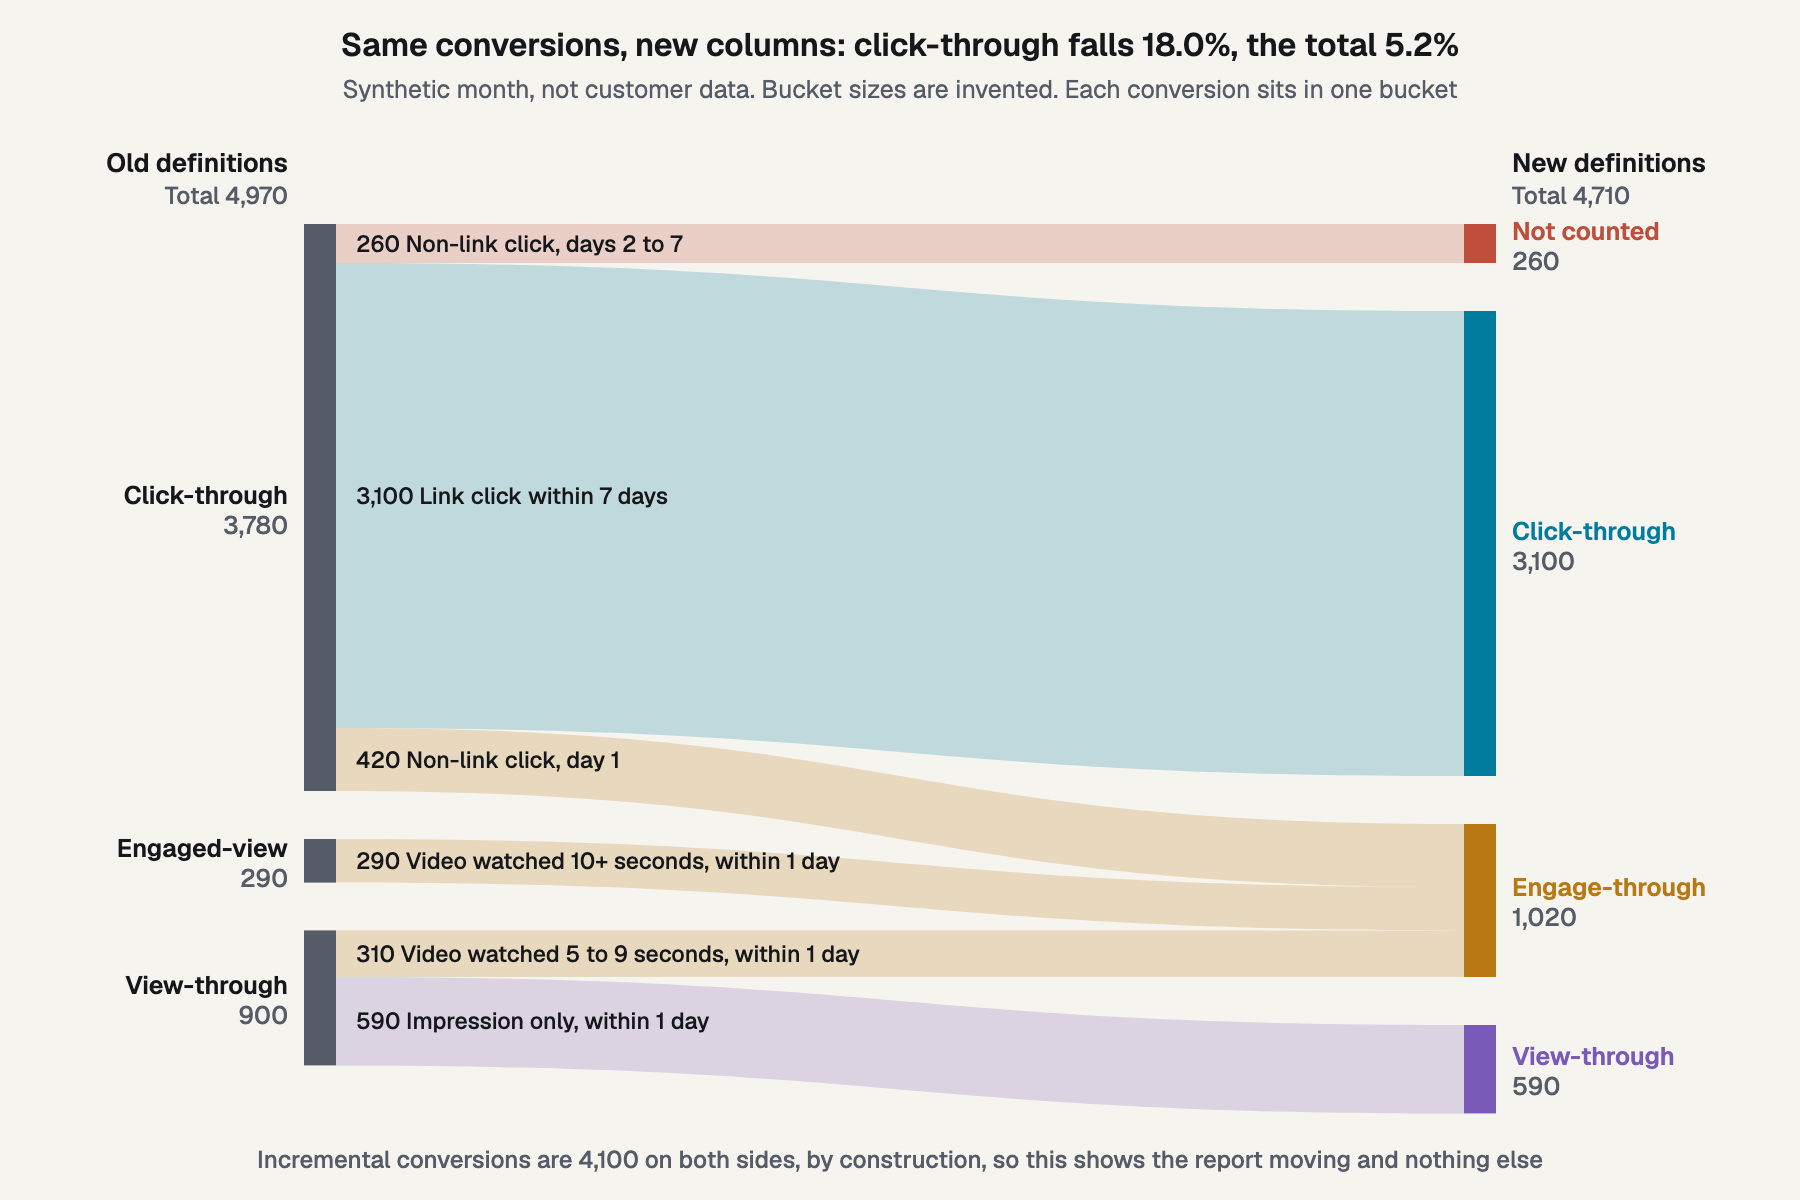
Figure 1. The same conversions, sorted under the old and new definitions.
- Click-through: Old: 3,780; New: 3,100; Change: -18.0%
- Engaged-view or engage-through: Old: 290; New: 1,020; Change: +251.7%
- View-through: Old: 900; New: 590; Change: -34.4%
- Setting total: Old: 4,970; New: 4,710; Change: -5.2%
So the size of the move depends on the column you read. A team watching click-through sees a large fall, and a team watching the setting total sees a small one. Engage-through jumps because it's collecting from two other columns.
My assumptions matter, so here they are:
- Each conversion is credited once, with click first, then engage, then view. I didn't find this priority on Meta's pages.
- Late non-link converters had no impression in the prior day, so they drop out.
- The old click-through covered all clicks for 7 days. I inferred that from Meta's statements, so check it in your account. The 260 depends on it.
- The bucket sizes are invented, and yours will differ.
Here's the check to run on your account. Plot Meta's click-through conversions divided by your own booked orders, weekly, for a year. A step with flat spend and flat orders is probably the change arriving. Because of the staged rollout, don't assume one date for every account, and write down the date you find.
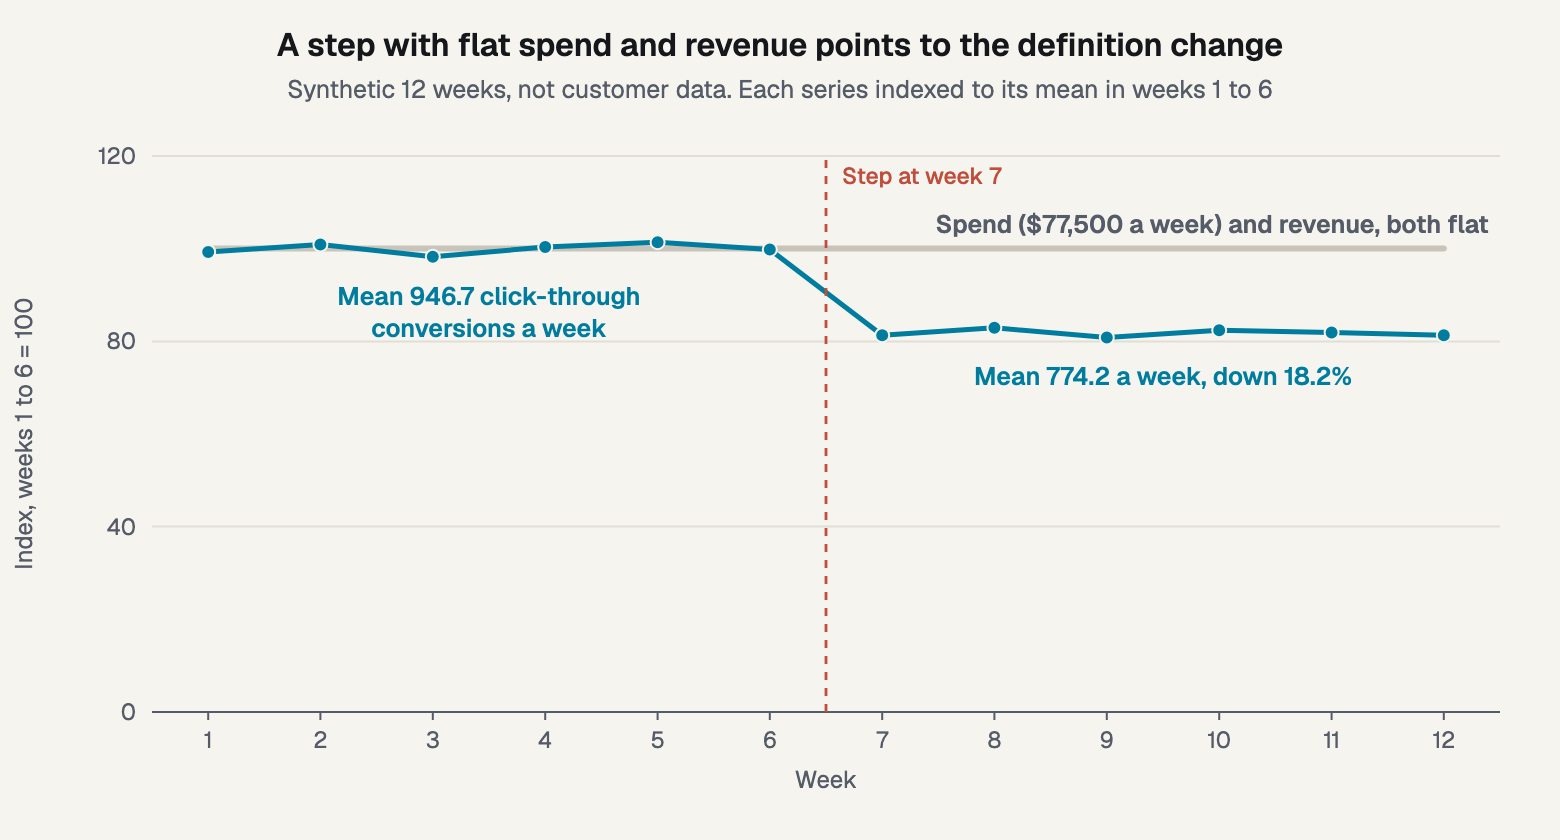
Figure 2. What the change can look like in a weekly series. Synthetic data, not customer data.
Why do your old factors stop working?
A factor is a ratio, and its denominator changed. The incrementality factor is incremental conversions divided by reported conversions. If you built one from a test before the change, it's tied to the old column.
- Factor on click-through: Old: 4,100 / 3,780 = 1.085; New: 4,100 / 3,100 = 1.323
- Factor on setting total: Old: 4,100 / 4,970 = 0.825; New: 4,100 / 4,710 = 0.870
- Stale click factor on new column: Old: n/a; New: 1.0847 x 3,100 = 3,362
- Stale total factor on new total: Old: n/a; New: 0.825 x 4,710 = 3,886
- Cost per click-through conversion: Old: $82.01; New: $100.00
- Cost per incremental conversion: Old: $75.61; New: $75.61
Apply the old click factor to the new column and you get 3,362 conversions against a true 4,100, an 18.0% miss. The stale total factor misses by 5.2%. Cost per click-through conversion rises 21.9% while cost per incremental conversion doesn't move. That's by construction, so this table doesn't show that the effect held. It shows how far a report can move with nothing else changing.
Published factors have the same problem. In July 2025, Haus reported that 7-day click under-reported incrementality by 15% on average, for direct-to-consumer brands, in a report on 640 tests. That's a vendor figure from its own customers, and it predates the narrowing. If an account's factor was 1.15 and its click column fell 18% with the effect unchanged, the factor would become 1.15 / 0.82 = 1.40. That's arithmetic from my synthetic 18%, and it isn't a new benchmark.
So keep each factor with the definition and date it was built on. Credit changing under a rule is a familiar problem, and why a channel's credit changes covers the version where a model's rules move. Here, the platform's definitions moved.
Could the effect have moved too?
Possibly, and the report can't tell you. "None of it changed how much revenue your advertising creates, only how it is reported," LiftLab states. That's a sensible default for billing and for the report itself. Their piece also gives a good order of work for re-baselining.
I'd stop short of that sentence for delivery, because Meta's own pages don't let me conclude it. Meta says attribution models "inform ad delivery and determine how conversions can be credited," so a setting reaches delivery. Standard attribution, it adds, "optimizes delivery for selected time windows and user behaviors," which says the same. The announcement says the shorter video window "should ultimately help improve advertiser performance as they use this for optimization," which claims delivery can respond.
So a change in a setting could, in principle, move delivery as well as the report. Meta's pages don't give a size, and I found no published measurement of it. The honest position is "possible and unmeasured", which is a reason to check and no reason to assume that performance changed.
A lift test before and after the date would settle it for your account. So would a geo test, as long as you record the date. Compare results that share a design, and note what else changed between them. Geo lift test design covers the setup, and what credit can't tell you covers why a test answers this and a column doesn't.
Is incremental attribution a test?
No. It predicts, and a test measures. Meta defines it as "an attribution model that optimizes ad delivery for incremental conversions," using machine learning to predict whether an ad caused a conversion. Meta also says it's "designed to help you better understand the relative incrementality between Meta campaigns."
Prediction can do well here, and it can also miss. On 2,226 Meta experiments, Gordon, Moakler and Zettelmeyer found a method trained on experiments reached an out-of-sample R² of 0.88 for incremental conversions per dollar. Seven-day last click reached 0.19. Moakler works at Meta, the method needs experiments to train on, and nothing I found says Meta's product uses it.
The same authors tested other non-experimental methods in Close Enough?, on 663 experiments. For mid-funnel outcomes, median lift was 18% by experiment, 58% by double machine learning and 176% by stratified propensity score matching. They conclude they were "unable to reliably estimate an ad campaign's causal effect" with such methods.
The published comparisons of Meta's model are mixed. Meta says its "latest Q4 model rollout drove a 24% increase in incremental conversions" over its standard attribution model, and it shows no method. Haus's 2026 re-analysis found incremental attribution at a pooled 1.11x standard, with a range of 0.96x to 1.27x. It was 0.80x in the earlier year and 1.26x in the later one. Haus itself cautions that the sample is "a modest number of tests" and that composition drove part of the jump.
To test it yourself, run two new campaigns on equal budgets, one on each model. Meta's setup page says "You cannot change your attribution model after you publish your campaign", and "You cannot use bid controls" with it. So build both from the start. Read both on your own revenue, since Meta recommends comparing within one attribution model. Reading a Conversion Lift study covers Meta's own experiment, where bounds come at a 90% credible interval. That interval is a statement given the study's model and assumptions, so it doesn't promise the true lift sits inside.
What should you do now?
Do four things, in this order:
- Find your account's date. Run the orders ratio above and write it down.
- Rebuild any factor from a test. Use the current definition, and store the date with it.
- Rebuild any prior built on platform numbers. Priors in a Bayesian model covers how, and I study what one test changes separately.
- Check your data feed. The list below covers it.
Do not:
- Carry an old factor forward.
- Compare across ad sets with different attribution models. Meta says those results "cannot be compared" in the Campaign Overview table.
- Treat the incremental column as a lift test result.
- Refit a model just because a dashboard moved.
That last one needs a reason. A model reading weekly spend and booked revenue doesn't take attributed conversions as an input. So a change in how Meta counts doesn't enter the fit directly. It would still see any real change in delivery, through revenue. Bayesin shows attribution and the model, side by side, and keeps them labeled.
Here's the data feed list:
- Windows. Does your extract still ask for
7d_viewor28d_view? - History. Meta's post gives limits of 37 months for totals, 13 for unique-count and hourly breakdowns, and 6 for frequency.
- Field names. The API reference still names
1d_ev, so check how your connector labels it. - Mixed settings. Meta's breakdowns page says metrics are unavailable on "an attempted aggregation across multiple attribution settings," so don't sum across them.
- Raw pulls. Store them with dates, since a platform can restate.
Frequently asked questions
Is my Meta performance worse?
The column can't tell you. Check booked revenue against spend, and use a test for the effect. In the synthetic bridge, click-through conversions fall 18.0% and cost per click-through conversion rises 21.9%, while incremental conversions are fixed. So a falling column alone doesn't show that performance fell.
Should I switch to incremental attribution?
Test it first, in equal-budget new campaigns, because you can't change the model after you publish. Meta reports a 24% gain and Haus reports a mixed picture that improved in its later year. Read both cells on your own revenue, and treat a single result as one data point.
Do I need to refit my model?
Not because of the report. A model on weekly spend and booked revenue doesn't take attributed conversions as an input. Check any prior or factor built from platform numbers, though, since those carry the old definition. If a test shows that delivery changed, the next refit should see it in revenue.
Did billing change?
Meta says no: "There will be no change to how advertisers are billed." The change affects which column a conversion lands in. Your spend isn't different because of it, though cost per conversion in a narrower column will look higher.
What to do next
Run the orders ratio this week, then list every factor and prior you hold, with its date. The same logic applies to four questions for any paid channel. It also connects to spend that follows demand and when a mix shift moves a reported number.
Where the model knows least, Bayesin designs the test. Your team runs it, and Bayesin tracks it and reads the result.
Sources
- Meta for Business, "Simplifying Ad Measurement for a Social-First World," announcement, 2026
- Meta Business Help, "About Attribution Models and Attribution Settings," documentation
- Meta Business Help, "About Incremental Attribution," documentation
- Meta Business Help, "How to Use Incremental Attribution in Meta Ads Manager," documentation
- Meta Business Help, "How to View Results for Incremental Attribution in Meta Ads Manager," documentation
- Meta Business Help, "Facebook Lift Metrics Glossary," documentation
- Meta for Developers, "Ads Insights API Metric Availability Updates," blog post, 2025
- Meta for Developers, "Graph API Reference v26.0: Ads Action Stats," documentation
- Meta for Developers, "Insights API Breakdowns," documentation
- Meta, "2026: AI Drives Performance," company post, 2026
- arXiv, "Predicted Incrementality by Experimentation (PIE) for Ad Measurement," Gordon, Moakler and Zettelmeyer, 2023, revised 2026
- arXiv, "Close Enough? A Large-Scale Exploration of Non-Experimental Approaches to Advertising Measurement," Gordon, Moakler and Zettelmeyer, 2022
- Haus, "The Meta Report: Lessons from 640 Haus Incrementality Experiments," vendor research, 2025
- Haus, "Is Meta's Incremental Attribution Outperforming Standard Attribution? What the Data Shows," vendor research, 2026
- LiftLab, "Meta's Attribution and DMA Changes: What They Mean for Your Geo Lift Testing and MMM," vendor post, 2026
See it on your own rows.
Bayesin is pre-launch. Join the waitlist and we will reach out as access opens.
Get new posts by email.
New posts only. See privacy for what we keep.