Testing
Which channel should you test first? Rank by what a test would teach
Which channel to test first? Six synthetic channels show why the largest spend ranks fifth once you ask what a test would narrow and what it would change.
Brandon Cade · Nov 2, 2026 · 12 min read
Key Takeaways
- Rank test candidates by what a test would change, not by spend.
- In six synthetic channels, the largest ranks fifth on decision value, because its interval already clears break-even.
- Estimate how far a test narrows each interval.
- Check whether the range straddles break-even.
- Then confirm you can hold the channel out.
In this synthetic brand, the channel with 37% of the spend ranks fifth of six as a test candidate. You can only run a few tests a year, and each one costs revenue and weeks. That makes deciding which channel to test first as important as the design.
This post takes you from model intervals to a ranked list you can rebuild in a spreadsheet, with the reason for each position. A test here means pausing a channel in randomly chosen regions and comparing them with the rest, and those regions are the holdout. I built every number below for this example, so they're illustrative rather than customer data or channel benchmarks, and the channel names are only labels.
Which channel should you test first?
Test the channel where the answer could change what you do, and where a test you can afford will narrow the range. Spend matters only through those two checks.
Tests are scarce because they're noisy. In 2015, Lewis and Rao studied 25 large field experiments and found a median confidence interval on return over 100 percentage points wide. Even a large test, in other words, can leave a budget owner unsure of the call.
You still test, because other methods can miss by more. In 2022, Gordon, Moakler and Zettelmeyer compared two observational methods with 663 experiments at Facebook. For upper-funnel campaigns, the better method's median absolute gap in lift was 115 percentage points, against a median experimental lift of 28%.
So a test is worth running and worth aiming, and I've written separately about what a test measures that attribution can't. The question here is narrower: with room for one test this quarter, which channel goes first?
Six channels, three rules, three different answers
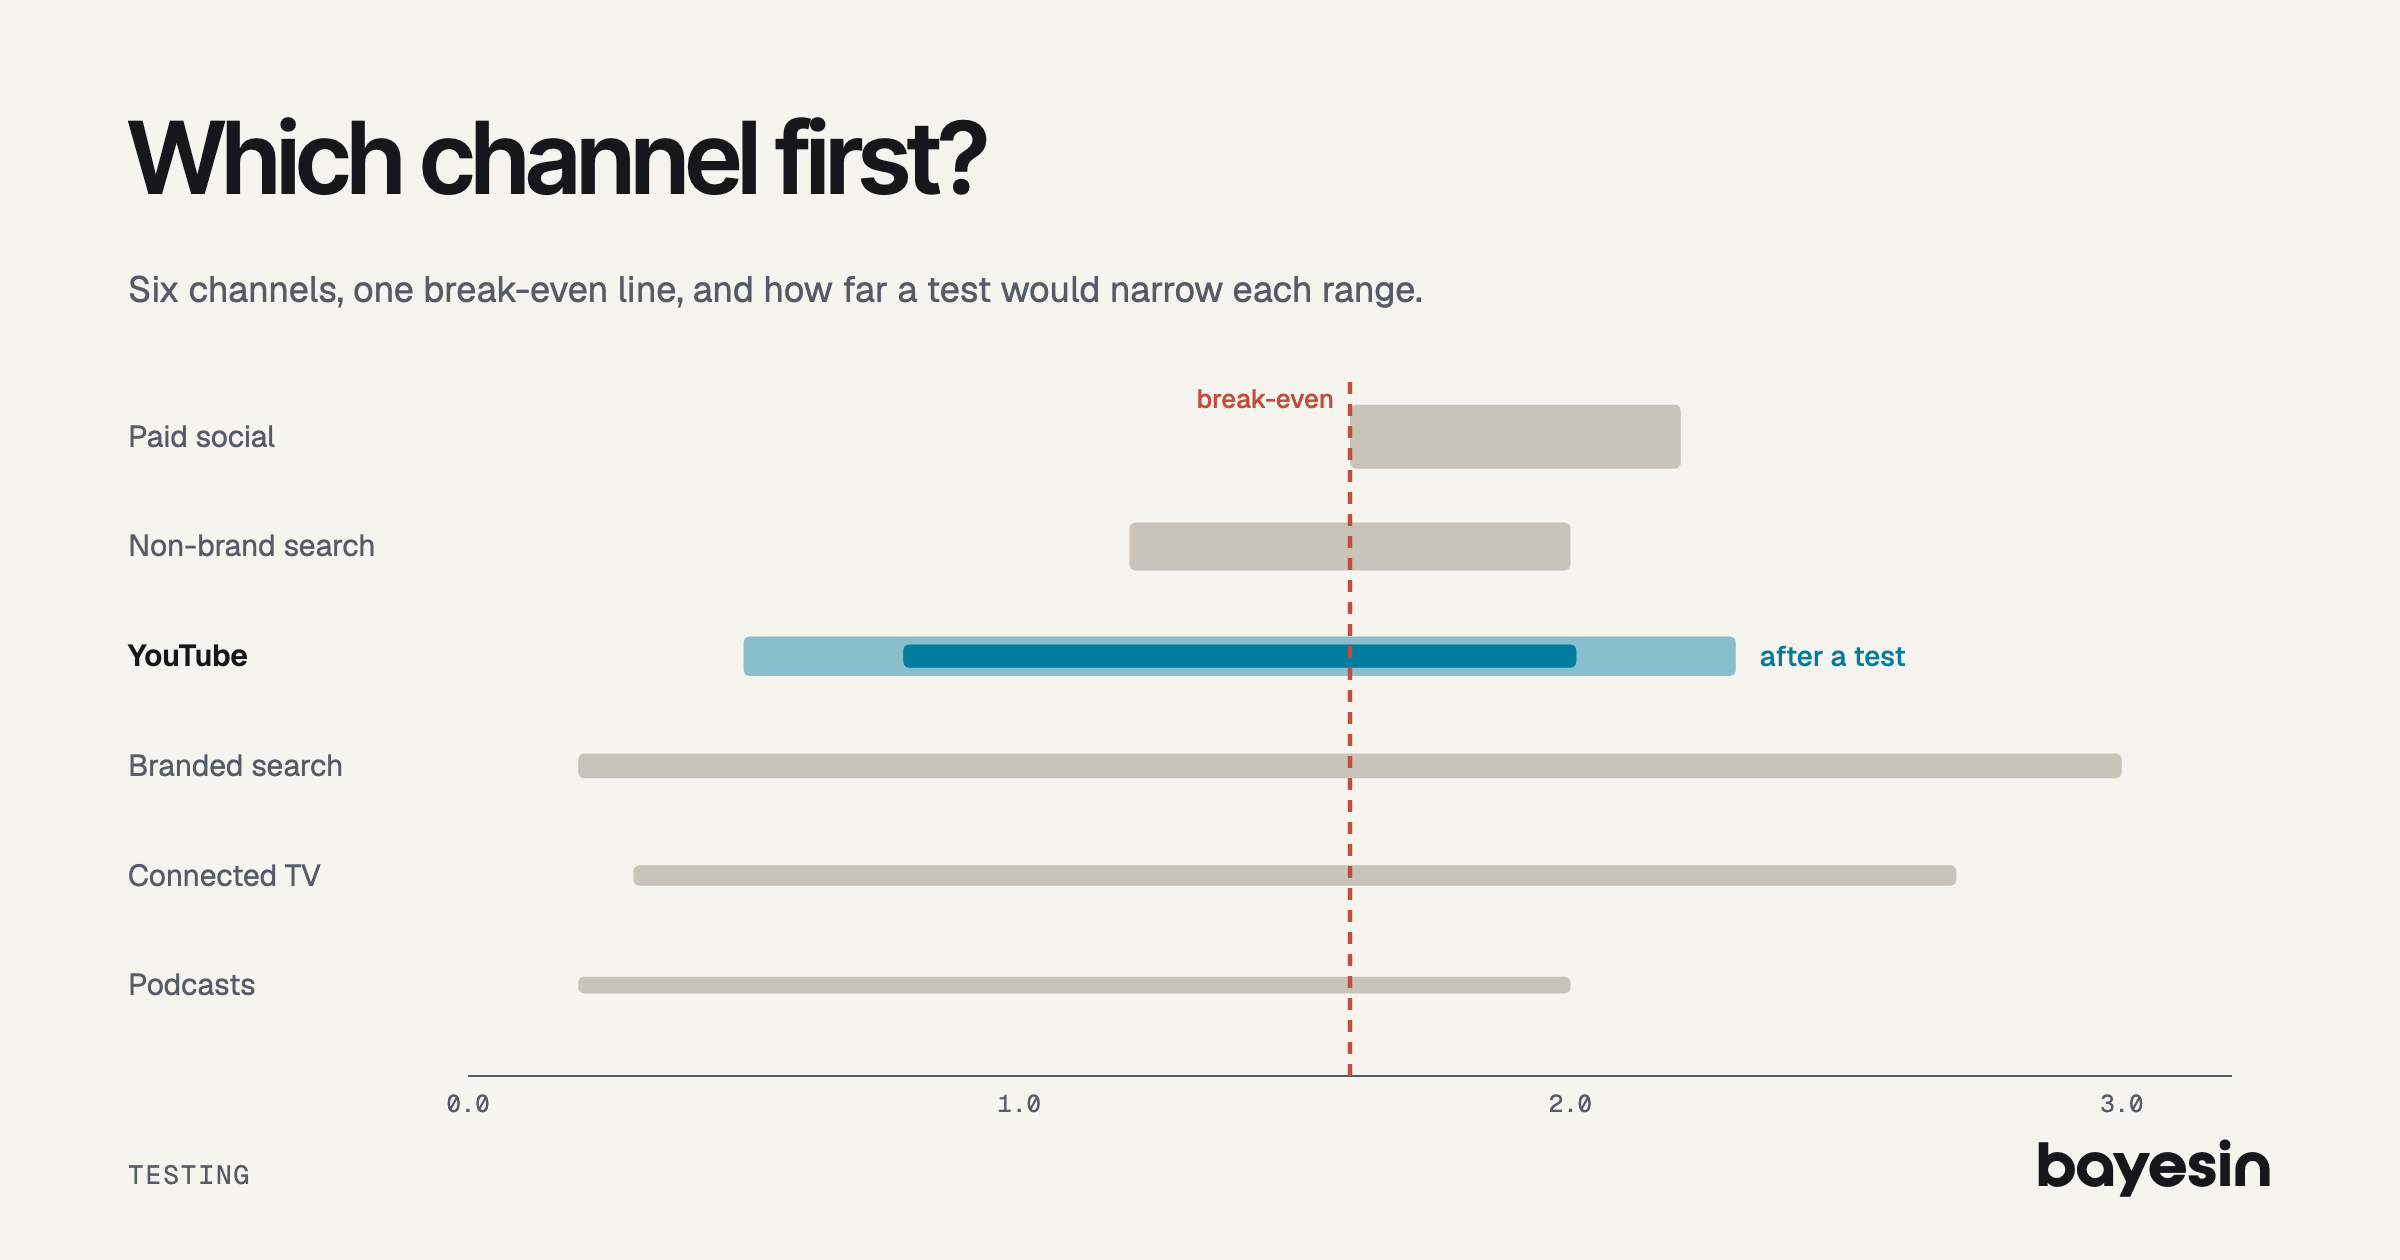
Largest first picks paid social, widest first picks branded search and then connected TV, and width times spend picks YouTube. That's one set of channels and three different first tests.
The synthetic brand has weekly revenue of $940,000 and spends $212,000 a week across six channels. Its margin is 62.5%, so break-even return is 1 / 0.625 = 1.6. Each channel also has an 80% credible interval on return from a media mix model.
I gave every channel the same test design, because that keeps the comparison simple. It pauses the channel in regions holding 20% of revenue for 6 live weeks, then reads at week 8. Real designs would differ, and branded search, for example, might run a shorter window.
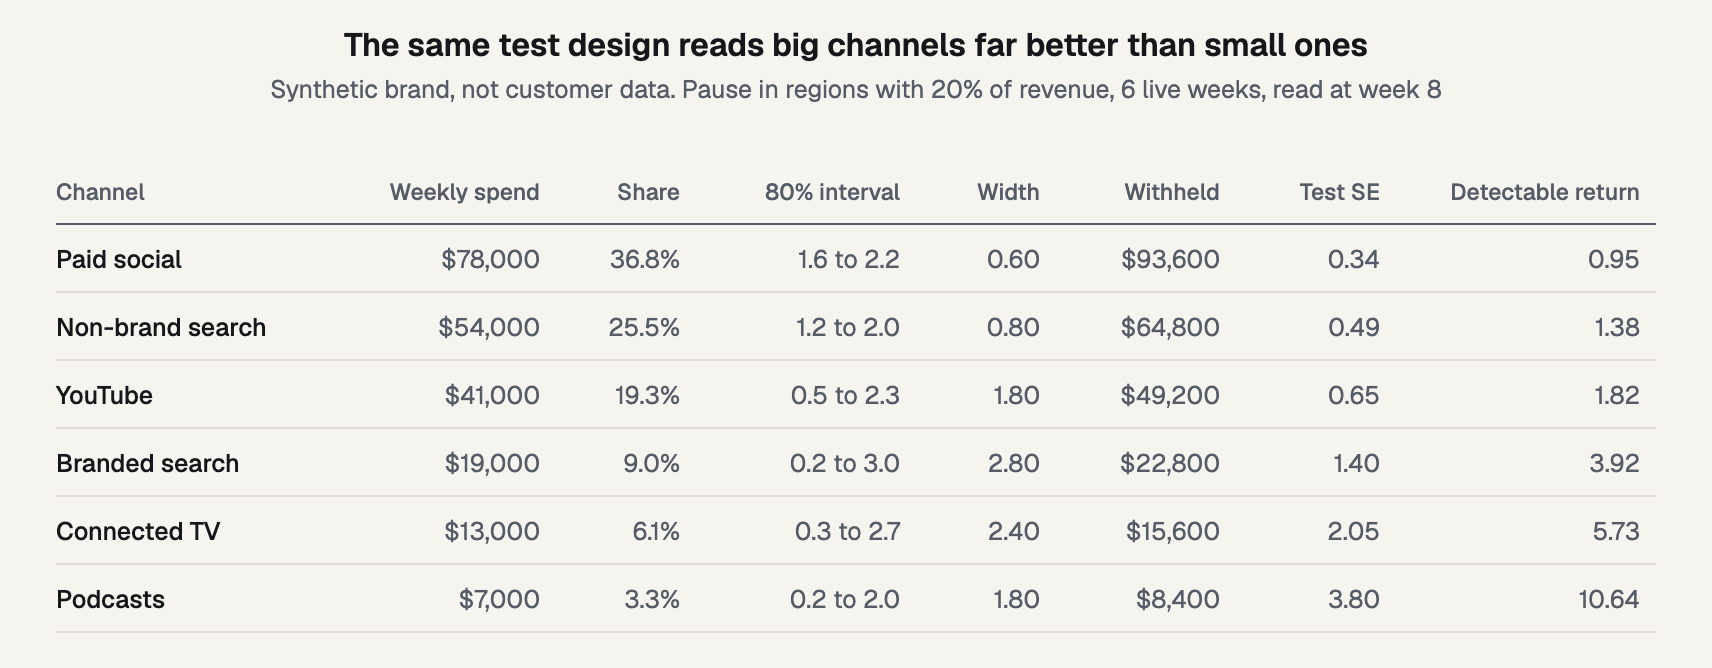
Figure 1. The inputs for all six channels, under one shared test design.
Each rule has its own logic: largest first says that's where the money is, and widest first says that's where the model knows least. Width times spend joins the two, and none of this is a new observation. Sellforte and Recast both argue, as vendors, that spend alone shouldn't decide, and Mass Analytics says to start where uncertainty times budget is highest. What I want to add is the arithmetic behind those views.
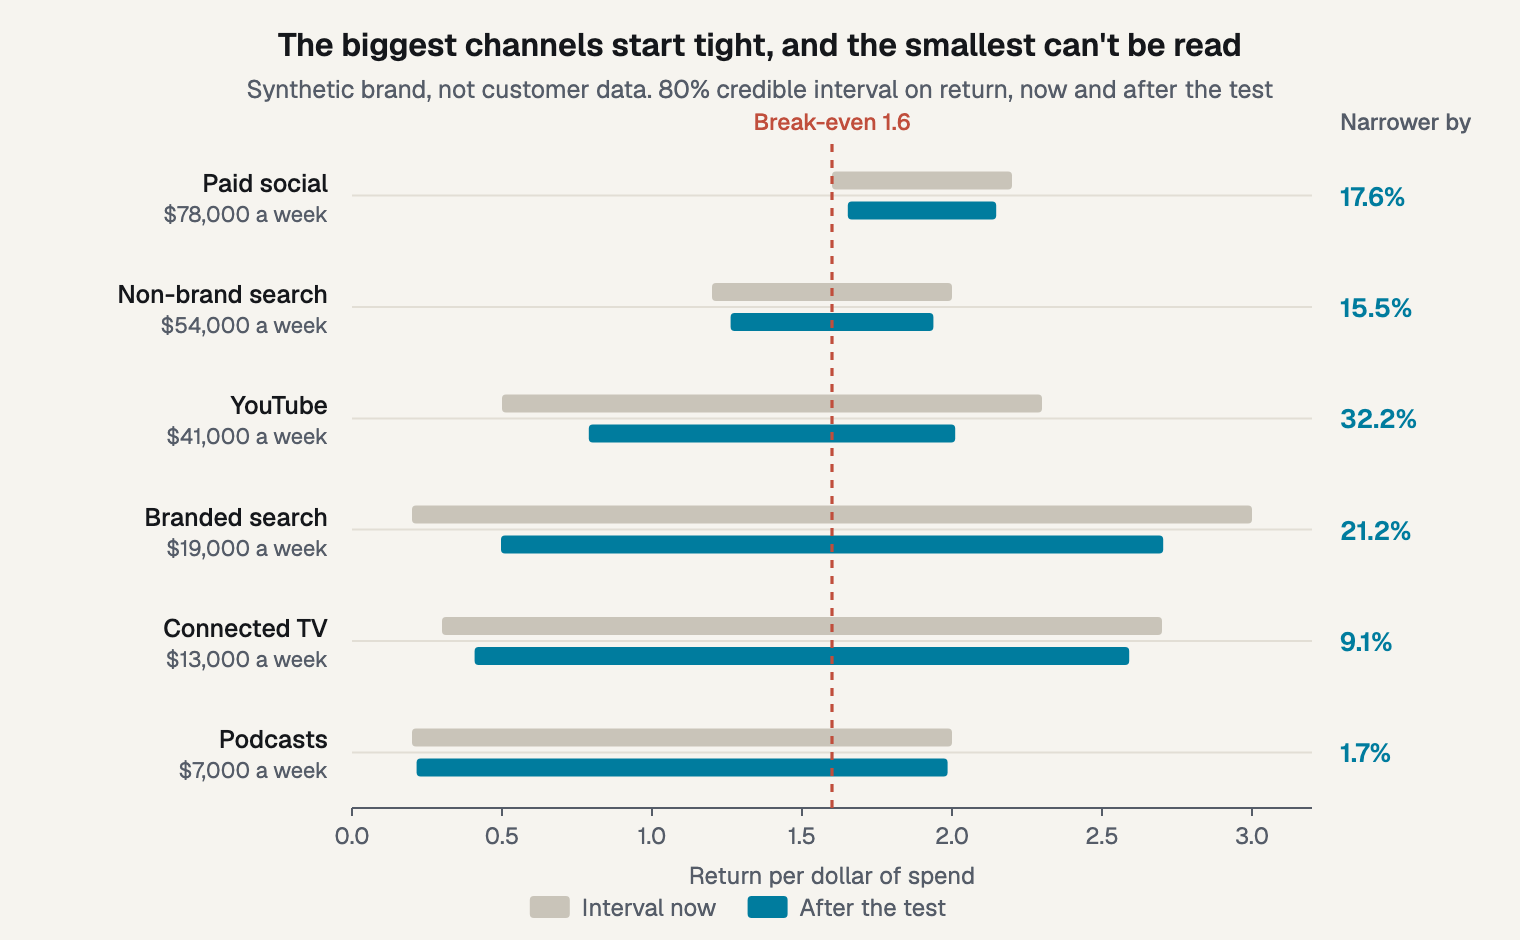
Figure 2. The same test narrows some intervals far more than others.
How much would a test narrow this interval?
A test narrows an interval according to its precision against the model's own uncertainty. That precision depends on the dollars you change, so the same noise hits small channels far harder.
Start with noise, which every channel shares. The holdout regions earn $188,000 a week, and suppose placebo tests on past weeks show a weekly counterfactual error of 6%, or $11,280. Over the 8-week read, that comes to $11,280 x sqrt(8) = $31,905, assuming independent weeks.
Dollars, however, aren't shared: YouTube withholds $41,000 x 0.2 x 6 = $49,200, while podcasts withhold only $8,400. Divide the noise by those dollars and the test standard error is 0.65 for YouTube and 3.80 for podcasts.
Here are the five steps for YouTube, whose interval runs from 0.5 to 2.3:
- Convert the interval to a standard deviation. 1.80 / 2.563 = 0.702. The divisor is twice 1.2816, the 90th percentile of the Normal.
- Find the test standard error. $31,905 / $49,200 = 0.648.
- Update. The standard deviation after the test is 1 / sqrt(1/0.702^2 + 1/0.648^2) = 0.476.
- Find the new width. 0.476 x 2.563 = 1.22, which is 32.2% narrower than 1.80.
- Multiply by spend. $41,000 x (1.80 - 1.22) = $23,734 of weekly revenue range removed, using unrounded width.
Those five steps need no test result, which is what makes them useful. In this calculation, YouTube's standard deviation falls from 0.702 to 0.476 and its 80% interval narrows 32.2%. Both figures come only from the model's width and the design's noise, so you can compute them before you spend a dollar of test budget.
Narrowing runs from 32.2% for YouTube down to 9.1% for connected TV and 1.7% for podcasts. Connected TV has the second-widest interval, but $15,600 withheld is small against $31,905 of noise.
Treat the result as a planning number. A credible interval holds the true return with a stated probability, given the model and its priors. I cover this in how to read a credible interval, and it isn't a guarantee, so a real test can land differently.
The open-source documentation is candid about this. PyMC-Marketing's lift test notebook warns that adding lift tests doesn't guarantee an improvement in every parameter. Google's Meridian documentation adds that translating an experiment into a prior carries uncertainty beyond its standard error, so treat the width after as a floor. On the other side, Zhang and colleagues at Google found in simulations that calibrating through the return prior reduced bias and uncertainty. That's how a result can inform a prior.
Would the answer change what you do?
Information has value only if it could change a decision, so check each range against your break-even line. A channel that clears the line on nearly any result has little left to teach.
Paid social's chance of being above 1.6 is 90%, while YouTube's is 39% and non-brand and branded search both sit at 50%. A return below break-even is a live possibility in real data too. In 2021, Shapiro, Hitsch and Tuchman found negative return at the margin for more than 80% of 288 TV brands.
To put a number on this, I use decision value. Decision value is the expected value of sample information, which Heath, Manolopoulou and Baio describe as the value of a study with a specific design. Dartmouth's lecture notes add that it excludes the cost of getting the information.
The question it answers is simple: on average, how much better is a keep or cut call made after this test? I applied it to 26 weeks, with 30% of each channel's spend in play, in contribution terms. For YouTube, the dollars in play are $41,000 x 26 x 0.30, and the sheet looks like this:
SD now = (high - low) / 2.563 = 0.702Test SE = noise / withheld = 0.648Spread S = SD^2 / SQRT(SD^2 + SE^2) = 0.516z = ABS(midpoint - break-even) / S = 0.388Loss = NORM.S.DIST(z,FALSE) - z*(1-NORM.S.DIST(z,TRUE)) = 0.2347Decision value = margin * dollars in play * S * Loss = $24,207
I checked the closed form with a Monte Carlo run of 4 million draws. It gave $24,236 for YouTube and $24,844 for branded search, against $24,207 and $24,841 from the formula.
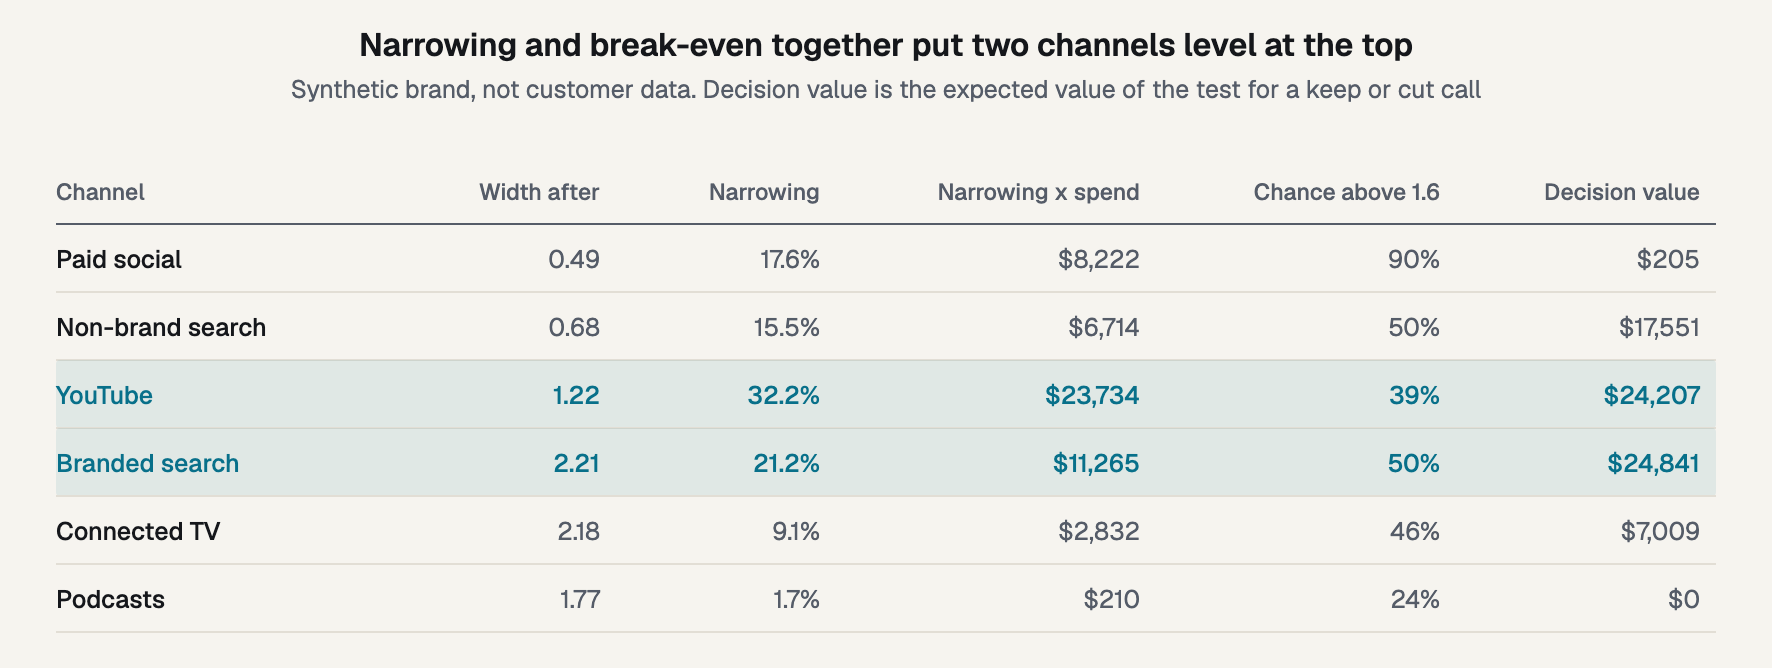
Figure 3. Narrowing and break-even together, for all six channels.
Width times spend gives the same order as narrowing times spend here: YouTube, branded search, paid social, non-brand search, connected TV, podcasts. That makes it a fair quick screen, though it can't see the decision line.
Adding that line reorders the list. Paid social falls from third to fifth, at $205, while non-brand search rises from fourth to third, at $17,551, since its range sits on break-even. Liu and Chamberlain make the general case in their 2019 paper: reducing uncertainty pays because it improves prioritization.
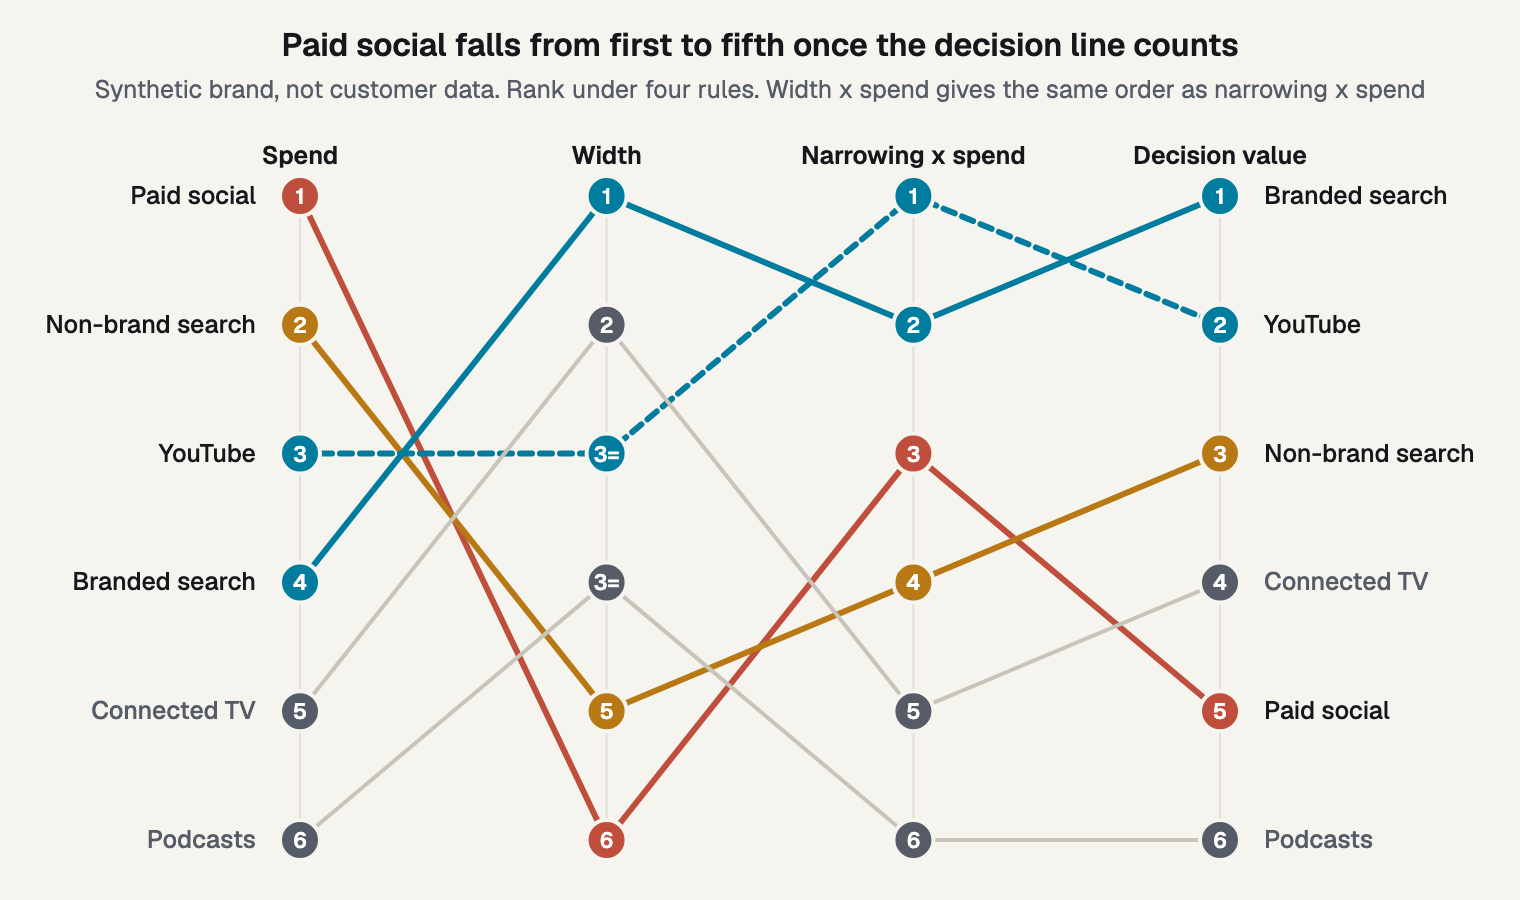
Figure 4. Paid social falls from first to fifth once the decision line counts.
Treat the top two as a tie. $24,841 and $24,207 differ by under 3%, and these inputs are assumptions. The order of all six held when I set weekly noise to 3%, 9% and 12%, so a different noise figure won't settle it. Two other numbers can.
The first is what a test can read by itself. Detectable return is the smallest return this design would catch 80% of the time at a 95% threshold, or 2.8 x test standard error. It describes the design and isn't a forecast of the effect. YouTube's is 1.82, with a 58% chance of crossing at its midpoint. Branded search's is 3.92, above the top of its interval, with a 21% chance. Its test would shift the model's estimate but would rarely stand alone in front of finance.
The second is cost: at the interval midpoints, the pause costs paid social $17,550 of contribution, which dwarfs its $205 of decision value. Branded search costs nothing at its midpoint, and YouTube saves $6,150, because its midpoint is below break-even.
Before the test, MarTech contributor Tom Leonard suggests agreeing what you'd do with each outcome. I'd add one line: if no outcome changes the plan, drop the test.
The update has limits worth stating. It treats the interval as Normal and the test as independent of the model, and real intervals can be skewed. A holdout also measures average return over the slice removed, not marginal return on the next dollar. Applying the interval to the dollars in play is therefore a simplification.
Can this channel actually be held out?
A ranking only counts if you can run the test, so check targeting, volume and the calendar before you commit. Three questions cover most of it:
- Can spend be switched off by region, or is it a national buy?
- Does the test window hit a blackout, a launch or a peak?
- Is the cost acceptable against the decision it serves?
The last question is a trade-off rather than a pass or fail. In 2018, Feit and Berman showed that the profit-maximizing test size in test-then-deploy decisions is smaller than a standard hypothesis test suggests. That argues for weighing a test's cost against what the decision is worth, as decision value does above.
A flat channel can be a strong candidate, because the model has little to go on, and I cover channels with flat spend separately. Podcasts, by contrast, fail on arithmetic alone: at this design, a test narrows their interval by 1.7%.
When should you test the big channel anyway?
Test it when you doubt the narrow interval. A narrow interval reports how certain the model is, not whether it's right, so a test on a large channel also checks the model.
Branded search shows why confident numbers deserve a check. In a 2013 draft later published in Econometrica, Blake, Nosko and Tadelis found no short-term benefit from eBay's brand-keyword ads. They tie that finding to a large, well-known brand, so it doesn't carry over to smaller brands automatically.
In the table, paid social's $205 assumes the model is right about it. If you have a reason to doubt that, such as a recent tracking change, the table understates what its test could teach. Say so, and accept the $17,550 knowingly, because a big channel can be worth one check even when the arithmetic says otherwise.
What if you don't have a model yet?
Write down a low and high return for each channel before you test, then run the same steps. A written range from platform numbers and your own doubts stands in for the interval.
It's a weaker input, so label it as judgment. The break-even check still works, because it needs only the range and your margin. The noise calculation needs no model at all, only past revenue by region. Doing this before any test has a side benefit too: you've recorded what you believed, which makes the result easier to read later.
Frequently asked questions
Should I test my biggest channel first?
Only if its range straddles break-even, or you doubt the model. Size alone doesn't make a test useful. In the synthetic table, paid social holds 37% of spend yet ranks fifth of six on decision value, since a test rarely changes that call.
Is the channel with the widest interval always the best test?
No. Connected TV has the second-widest interval in the example, but the test narrows it only 9.1%, because $15,600 withheld is small against $31,905 of noise. A wide interval tells you what's unknown. It doesn't tell you a test of that size can resolve it.
How many tests should I run at once?
Run one test per channel at a time, and keep overlapping tests apart in region or calendar. Tests that overlap can be confused with each other, and the read gets harder to explain. If you have budget for two, take the top two rows that don't share regions.
Does this ranking need a Bayesian model?
No. Any range works, including a written one, because the arithmetic treats the range as Normal. A Bayesian model simply gives you a credible interval to start from. If your range comes from judgment, label it that way, and treat the resulting order as a prompt for discussion.
What to do this week
Write your six rows this week. Start with spend and a range for each channel, then work through three checks:
- How far would a test narrow this range?
- Could the answer change what you do?
- Can you hold this channel out?
Bayesin shows where the range widens past spend you've tried, which is one place to look for the next test. It designs, tracks and reads tests, while your team runs them, and Bayesin never changes spend.
Sources
- Quarterly Journal of Economics, "The Unfavorable Economics of Measuring the Returns to Advertising," Lewis and Rao, 2015
- Marketing Science Institute, "Close Enough? A Large-Scale Exploration of Non-Experimental Approaches to Advertising Measurement," working paper 22-106, 2022
- NBER conference draft, "Consumer Heterogeneity and Paid Search Effectiveness: A Large Scale Field Experiment," Blake, Nosko and Tadelis, 2013
- Econometrica, "TV Advertising Effectiveness and Profitability: Generalizable Results from 288 Brands," Shapiro, Hitsch and Tuchman, 2021
- arXiv, "Estimating the Expected Value of Sample Information across Different Sample Sizes using Moment Matching and Non-Linear Regression," Heath, Manolopoulou and Baio, 2018
- Dartmouth ENGS 41, "Decision Making: Value of Information," lecture notes, 2026
- arXiv, "What is the value of experimentation & measurement?," Liu and Chamberlain, 2019
- arXiv, "Test & Roll: Profit-Maximizing A/B Tests," Feit and Berman, 2018
- Google Research, "Media Mix Model Calibration With Bayesian Priors," Zhang et al., 2024
- PyMC-Marketing, "Lift Test Calibration," documentation, undated
- Google Meridian, "Calibrate treatment priors," documentation, 2026
- Sellforte, "How should we prioritize incrementality tests across markets and channels?," vendor guide, 2026
- Recast, "How to Prioritize Experiments When You Can't Run Them All," vendor post, 2025
- Mass Analytics, "Which Channels Need Incrementality Testing First?," vendor post, 2026
- MarTech, "Run fewer incrementality tests and get more from them," contributor opinion, 2026
See it on your own rows.
Bayesin is pre-launch. Join the waitlist and we will reach out as access opens.
Get new posts by email.
New posts only. See privacy for what we keep.