Testing
Holdout or scale-up: which test answers your budget question?
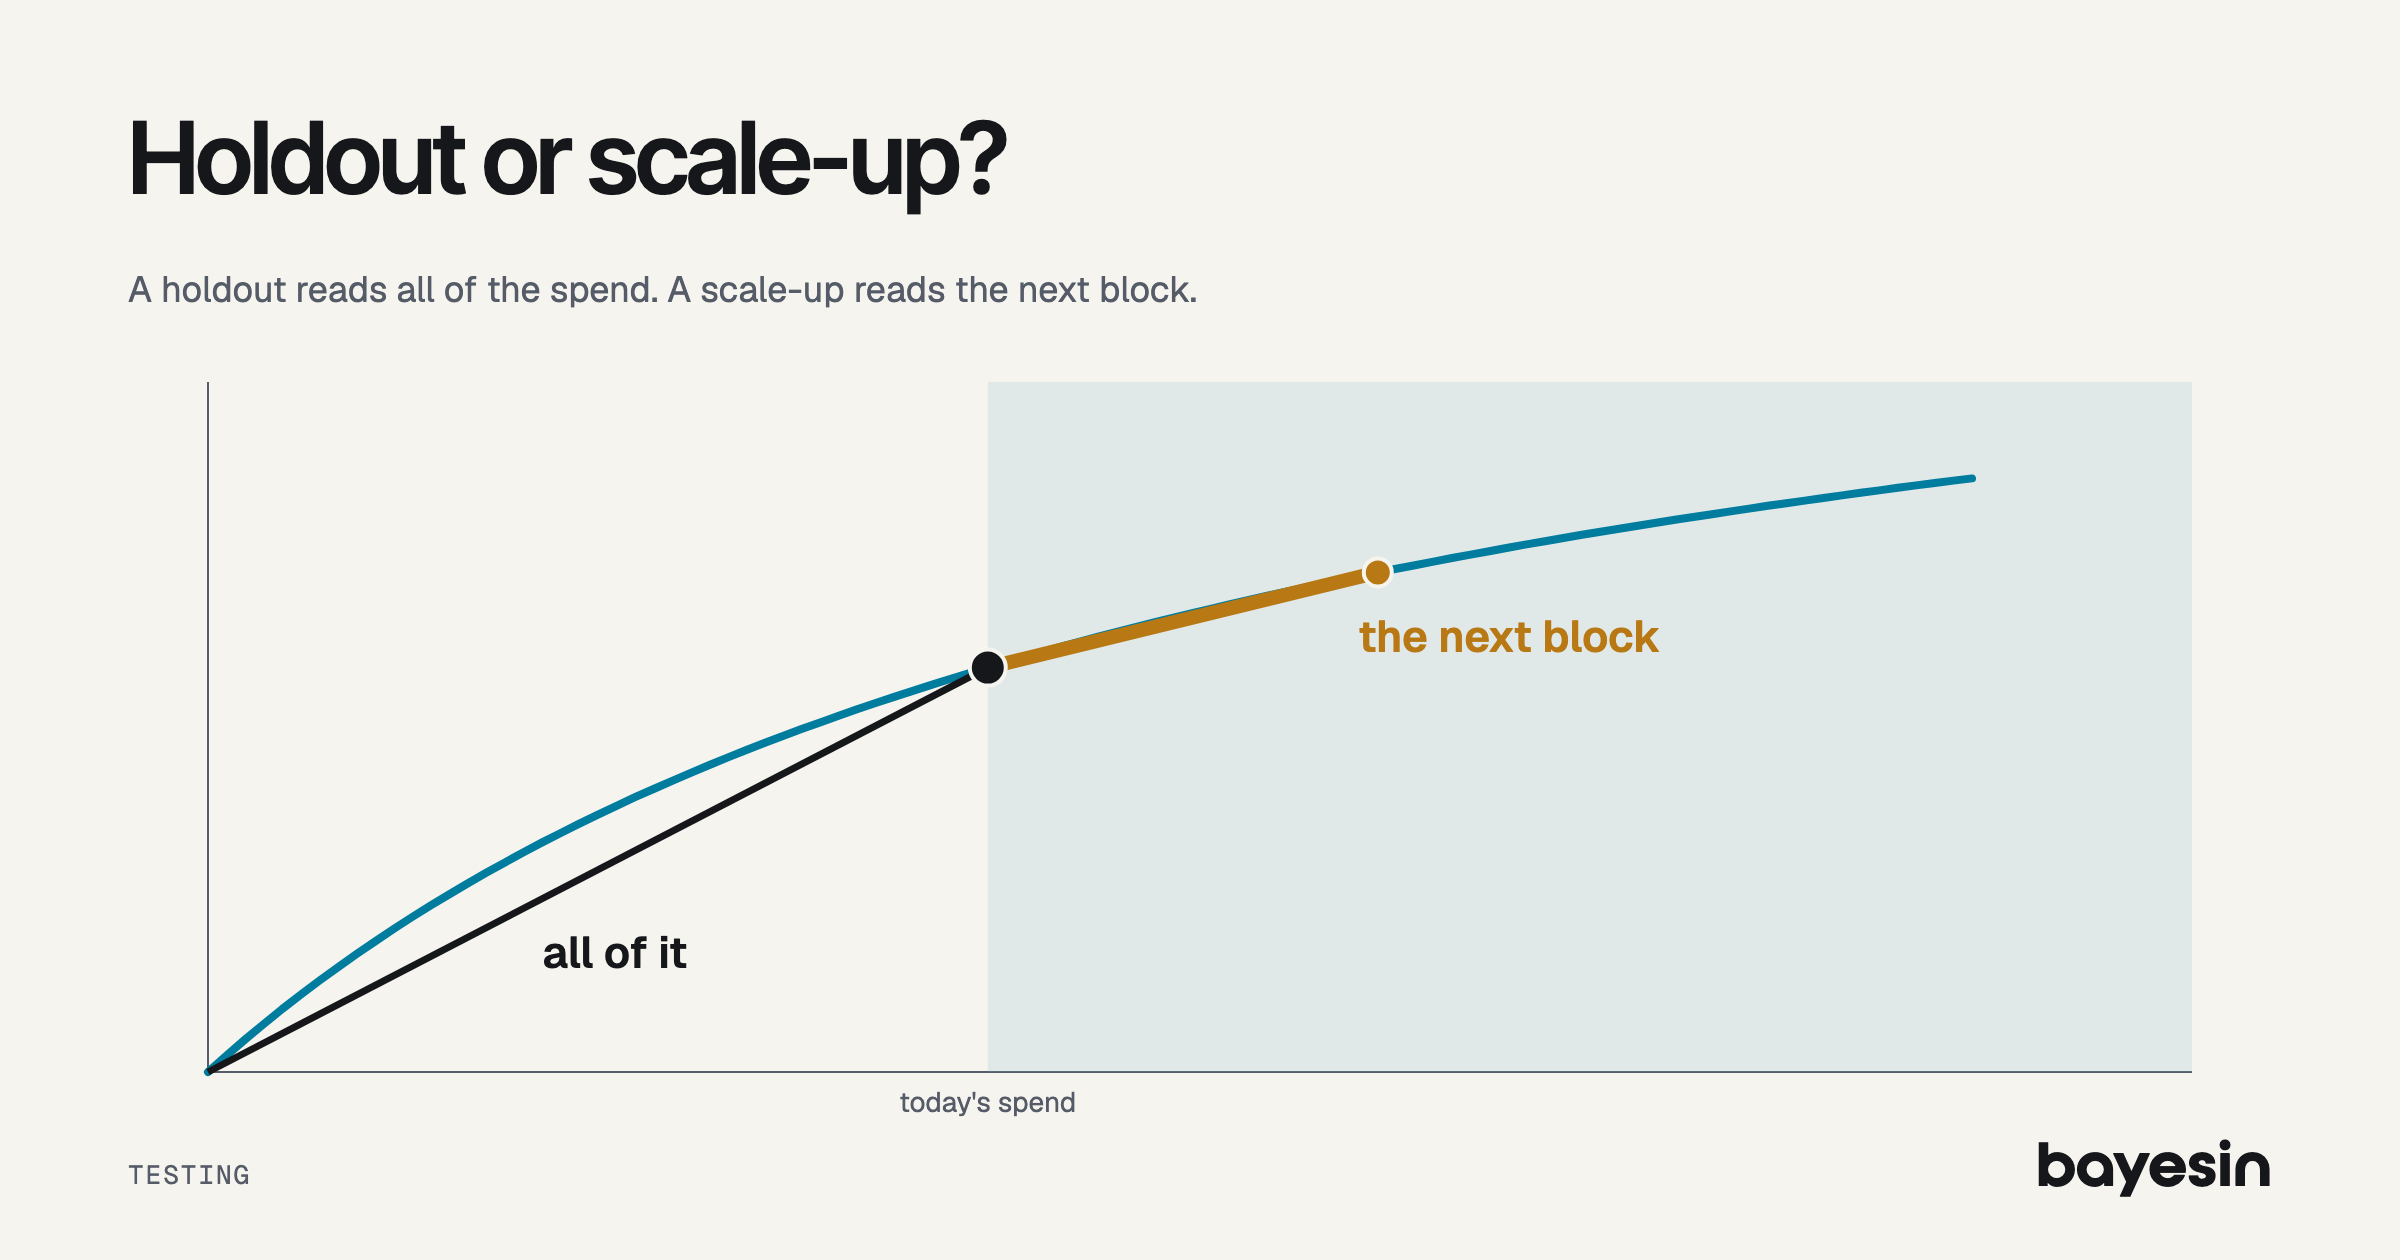
A holdout tells you what a channel earns today. A scale-up tells you what the next block of spend earns. See one curve, both tests and which fits your budget.
Brandon Cade · Nov 16, 2026 · 11 min read
Key Takeaways
- A holdout measures average return on all of a channel's spend. A scale-up measures return on the next block.
- Three synthetic curves share one holdout result of 2.14, while their best spend runs from about $37,000 to $116,000 a week.
- Choose the test by the decision you'll make.
Three synthetic channels each spend $84,000 a week and each earn $180,000 from it. A holdout on any of them returns 2.14. Yet the spend that fits runs from about $37,000 a week on one to about $116,000 on another.
So the test that's easiest to read can answer a different question from the one in your budget meeting. By the end of this post, you'll be able to match a test to your decision and check whether you can read it. You'll also judge the result against break-even as well as zero.
The curves and tables are synthetic: numbers I built for this post, not customer data. If you want the mechanics first, here's how a holdout works.
Holdout vs scale-up at a glance
A holdout tells you what the channel earns in total, and a scale-up tells you what more spend would earn. They read different parts of the same curve, so they can both be right and still point to different budgets.
- Question answered: Holdout: Is this channel worth having?; Scale-up: Should more budget go here?
- What changes: Holdout: Spend goes to zero in test regions; Scale-up: Spend rises in test regions
- Where it reads on the curve: Holdout: Everything from zero to today; Scale-up: The block above today
- What the direction costs: Holdout: Revenue forgone; Scale-up: Extra spend
- Signal for the same dollars: Holdout: Larger; Scale-up: Smaller
- Fit with a model's zero-spend baseline: Holdout: Direct; Scale-up: Needs translating
- Name in Google's documentation: Holdout: Go-dark; Scale-up: Heavy-up
A word on terms, since vendors differ. In this post, a holdout turns the channel fully off in the test regions. Some readers use the word for any withheld group, and Google's "holdback" is a separate design for new channels. Google's troubleshooting page calls a partial cut go-dim, and I'll just call it a cut.
What does a holdout measure?
A holdout measures what you'd lose if the channel went away. That loss, divided by the spend removed, is the average return across all of the channel's spend.
Google's Types of experiments page describes go-dark as measuring the incrementality of existing, live campaigns. The geo version goes back at least to 2011, when Vaver and Koehler at Google described assigning non-overlapping regions at random to control or treatment.
The match with a media mix model is the holdout's quiet strength. Google's Meridian calibration page says a model's counterfactual is zero spend, and a holdout creates exactly that condition. Meridian's parameter page treats ROI as total incremental outcome over total spend, which is the number a holdout returns.
Use a holdout for a keep or cut call, or for a channel with no earlier evidence. It's the strongest signal you can get from a given channel, because it moves the most dollars.
What it can't give you is the slope at today's spend. A holdout on a channel earning $180,000 from $84,000 returns 2.14, and that figure holds whether the next dollar earns $1.95 or $0.71. I've written separately about marginal and average return, so I won't repeat that here.
What does a scale-up measure?
A scale-up measures the return on added spend, and that's the number a budget increase depends on. You raise spend in the test regions, hold the rest as they are, and read the extra revenue against the extra dollars.
Google lists two uses for this design. One is "Forecasting marginal returns of increasing budget on established channels". The other is a channel whose current spend is too low to power a go-dark test.
A scale-up also tests spend you haven't tried, which no amount of history can do. Because it measures what actually happens at the higher level, the read already includes any rise in auction costs. Sellforte, a vendor in this space, makes the accounting point: count the extra spend relative to what you'd have spent with no test.
Two practical cautions apply. Google's troubleshooting page advises against raising a campaign's budget directly in the experiment, since that breaks the assumption that control regions stay on business-as-usual spend. If the budget has to rise, raise it first, then collect new pre-test data at the new level. Its implementation page adds that automated bidding may need extra test time for a learning period.
There's a modeling cost too. The Meridian calibration page warns that an experiment measuring marginal lift doesn't match a model's zero-spend counterfactual. Translating it into a prior adds uncertainty beyond the experiment's standard error.
Why can one holdout result fit three budgets?
A holdout pins one point on the curve, and many curves pass through that point. So the same result can sit under a channel that should shrink and one that should grow.
Here's the synthetic setup. The test regions earn $1,100,000 a week, the channel spends $84,000 a week there, and contribution margin is 55%. Break-even return is 1 / 0.55 = 1.82. Revenue from the channel follows a simple saturating form:
Revenue at spend s = Rmax x s / (s + k)Marginal return at s = Rmax x k / (s + k)^2
This form is a teaching device. It ignores carryover, and it isn't any product's curve. Advertising does show lag and diminishing returns, as Jin and colleagues at Google set out in 2017, and I cover why the curve bends elsewhere. Robyn's guide uses a Hill function for the same job. The argument below doesn't depend on the exact shape.
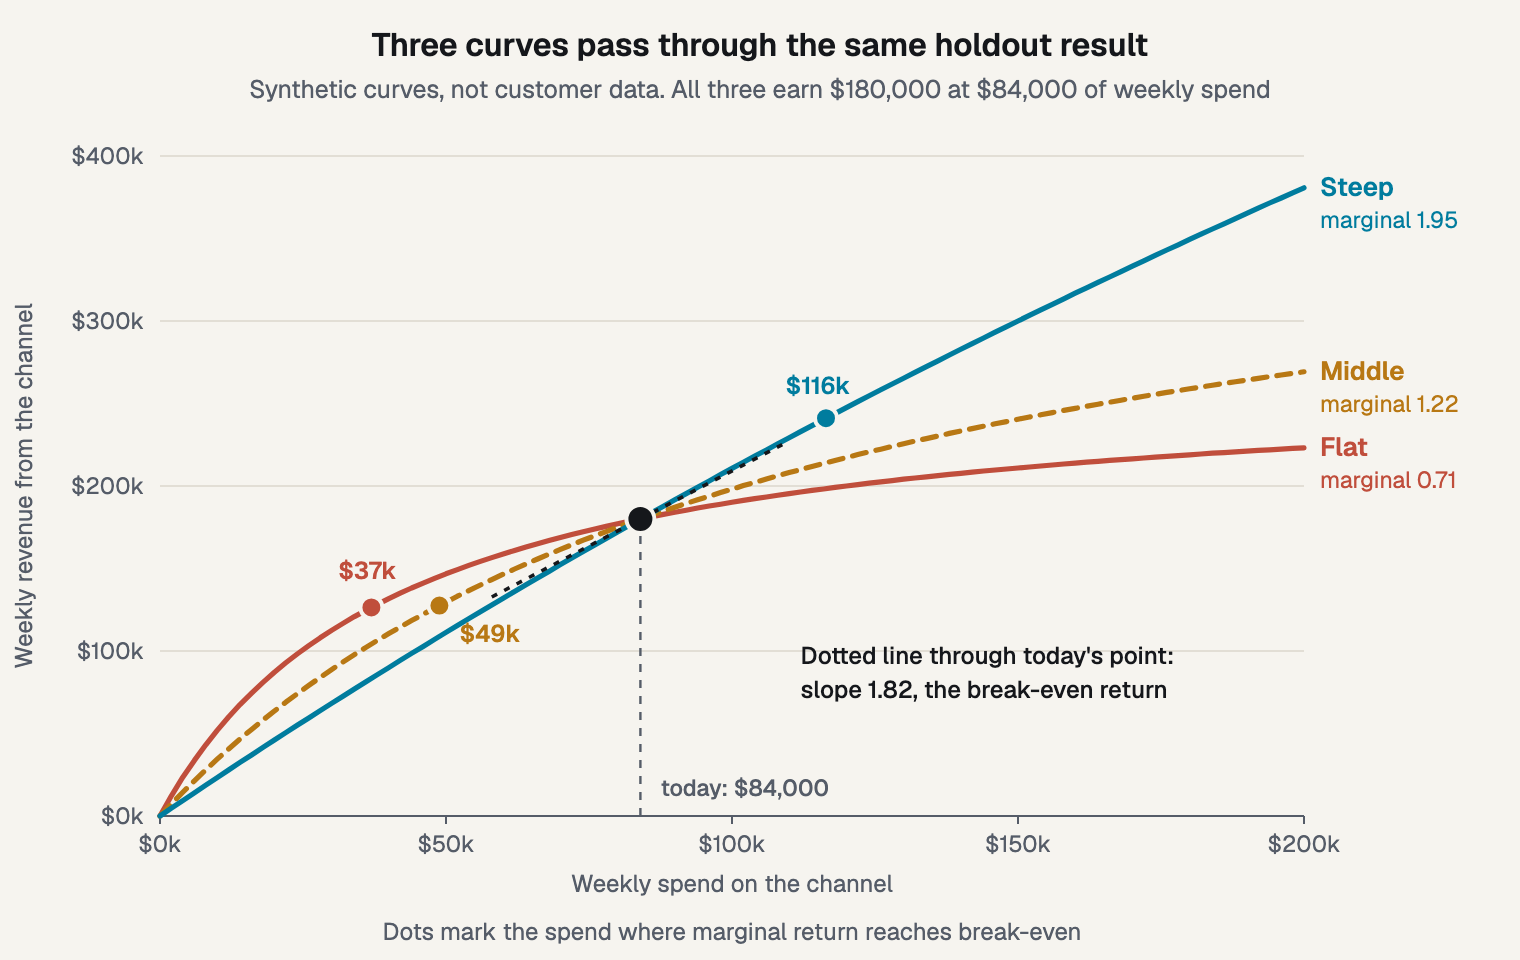
Figure 1. Three curves, one holdout result, three budget answers. Synthetic data, not customer data.
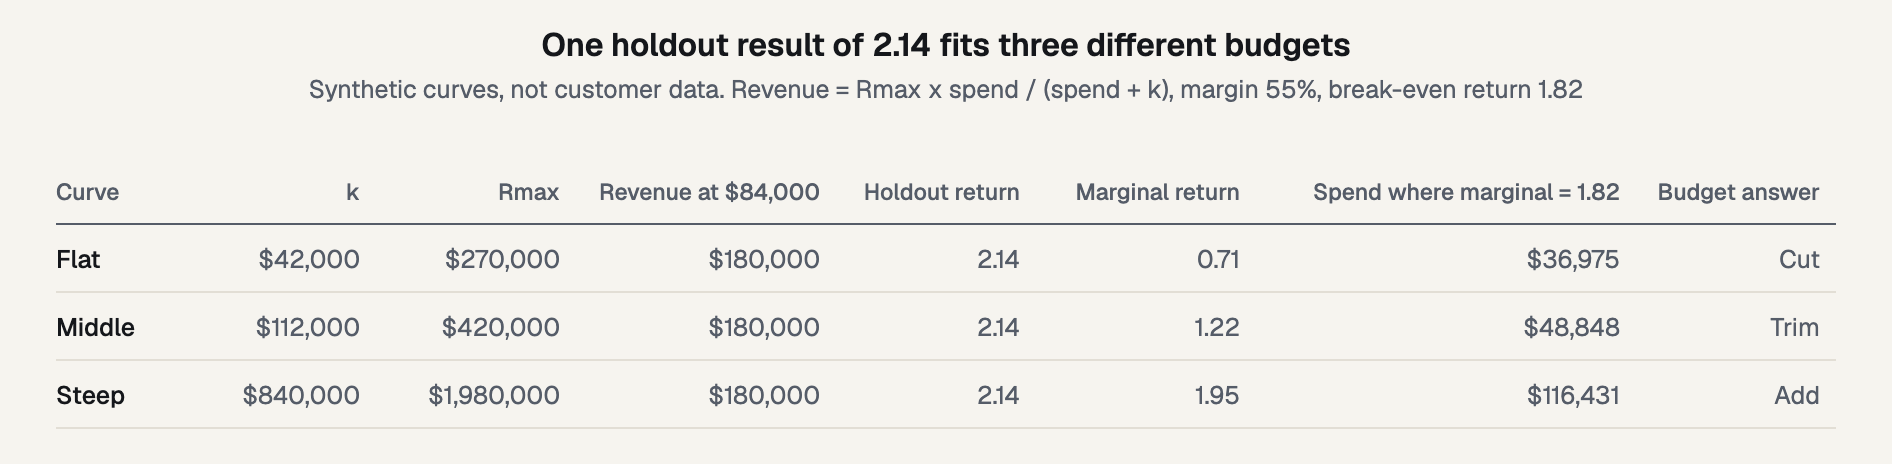
Figure 2. The inputs and answers for each curve, so you can rebuild them.
All three synthetic curves earn $180,000 on $84,000, so a holdout returns 2.14 and clears the 1.82 break-even on each. Marginal return at that spend is 0.71, 1.22 and 1.95. A channel can pass a holdout and still be over budget, and this is why.
The budget answers differ by a factor of about three. On the flat curve, spend should fall 56% to $36,975. On the middle curve it should fall 42% to $48,848, which is a large trim. On the steep curve it should rise 39% to $116,431. The holdout saw none of this, because it never asked about the slope.
Which test can you actually read?
For the same dollars moved, a cut gives a bigger signal than a scale-up on a concave curve. A holdout gives the biggest of all, because it moves the most dollars. Size that against your noise before choosing, because the test that fits your question may be the one you can't read.
Take the middle curve, with weekly residual noise of $40,000, or 3.6% of test-region revenue, over 8 live weeks. I treat those weeks as independent, and that makes this a floor. The standard error of the weekly lift is $40,000 / sqrt(8) = $14,142. Multiply by 2.8, the factor from power and detectable effect, by hand, and the minimum detectable effect is $39,598 a week.
The MDE is the smallest lift this design would catch 80% of the time at a two-sided 95% threshold. It describes the design. The expected lift is what you think the channel will do, and it has to sit above the MDE.
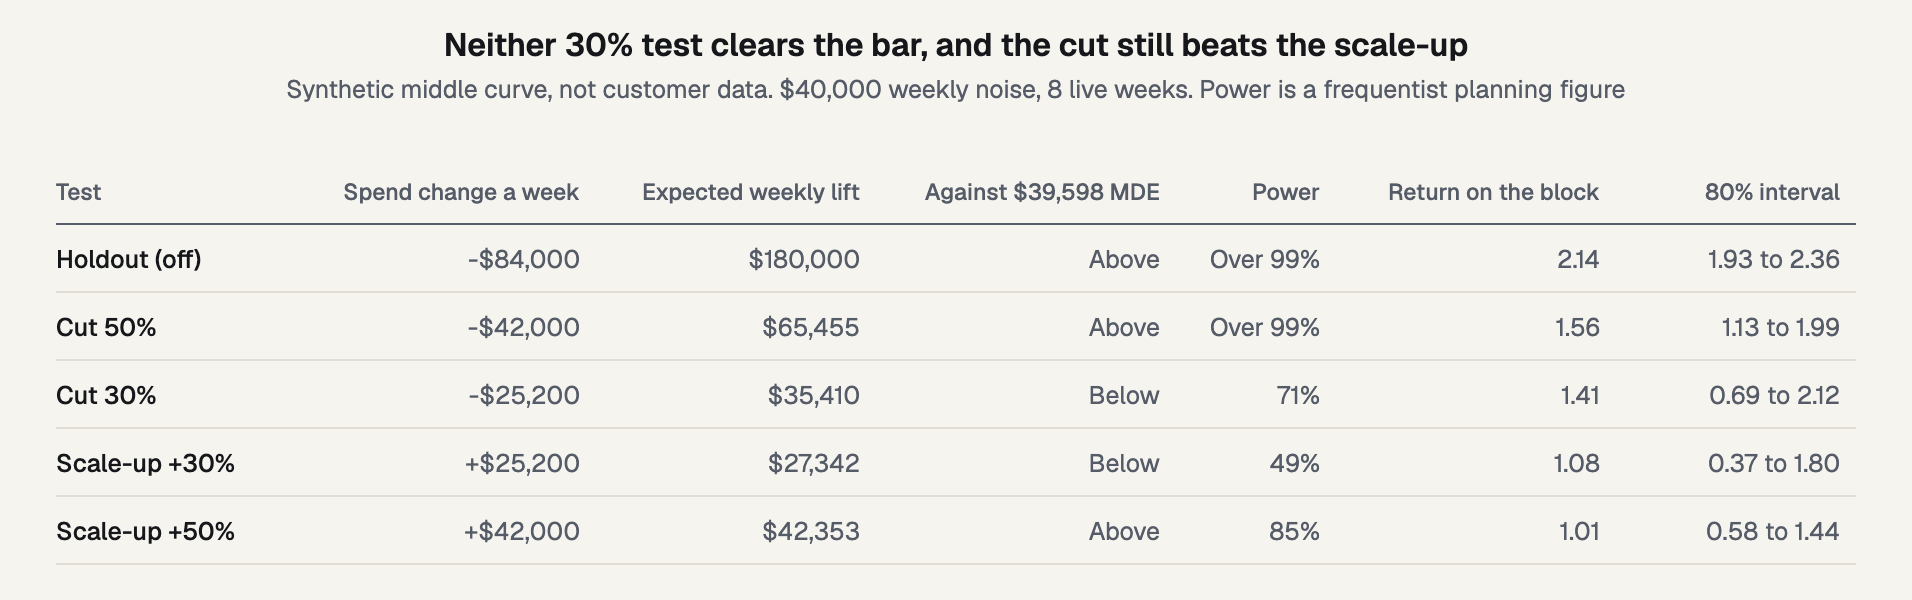
Figure 3. Five tests on one curve, at one noise level.
Four readings follow from the table:
- Neither 30% test clears the bar. A 30% scale-up would need about 17 weeks at this noise. That's past the 3 to 10 live weeks Google's implementation page gives, so go to 50% or accept the wider range.
- The same dollars don't tie. The curve is steeper below today's spend. Moving $25,200 yields $35,410 on a cut and $27,342 on a scale-up, so power is 71% against 49%.
- A lower threshold changes one row. With an 80% interval as the threshold, the multiplier is 2.12 and the bar is $29,981. The 30% cut clears it and the 30% scale-up doesn't, at a false alarm cost the sizing post also covers.
- Each row reads a block, not the next dollar. Marginal return is 1.22, between the +50% block at 1.01 and the -50% at 1.56. A bigger test detects more easily, and it averages over more of the curve.
The power column is a frequentist planning figure. The intervals are 80% normal intervals, which match 80% credible intervals under a flat prior. They use a different level from the MDE on purpose. A credible interval says where the return probably sits, given the model and the data. It doesn't confirm that the model is right. These intervals are also centered on the expected lift, so a real read would land somewhere around them.
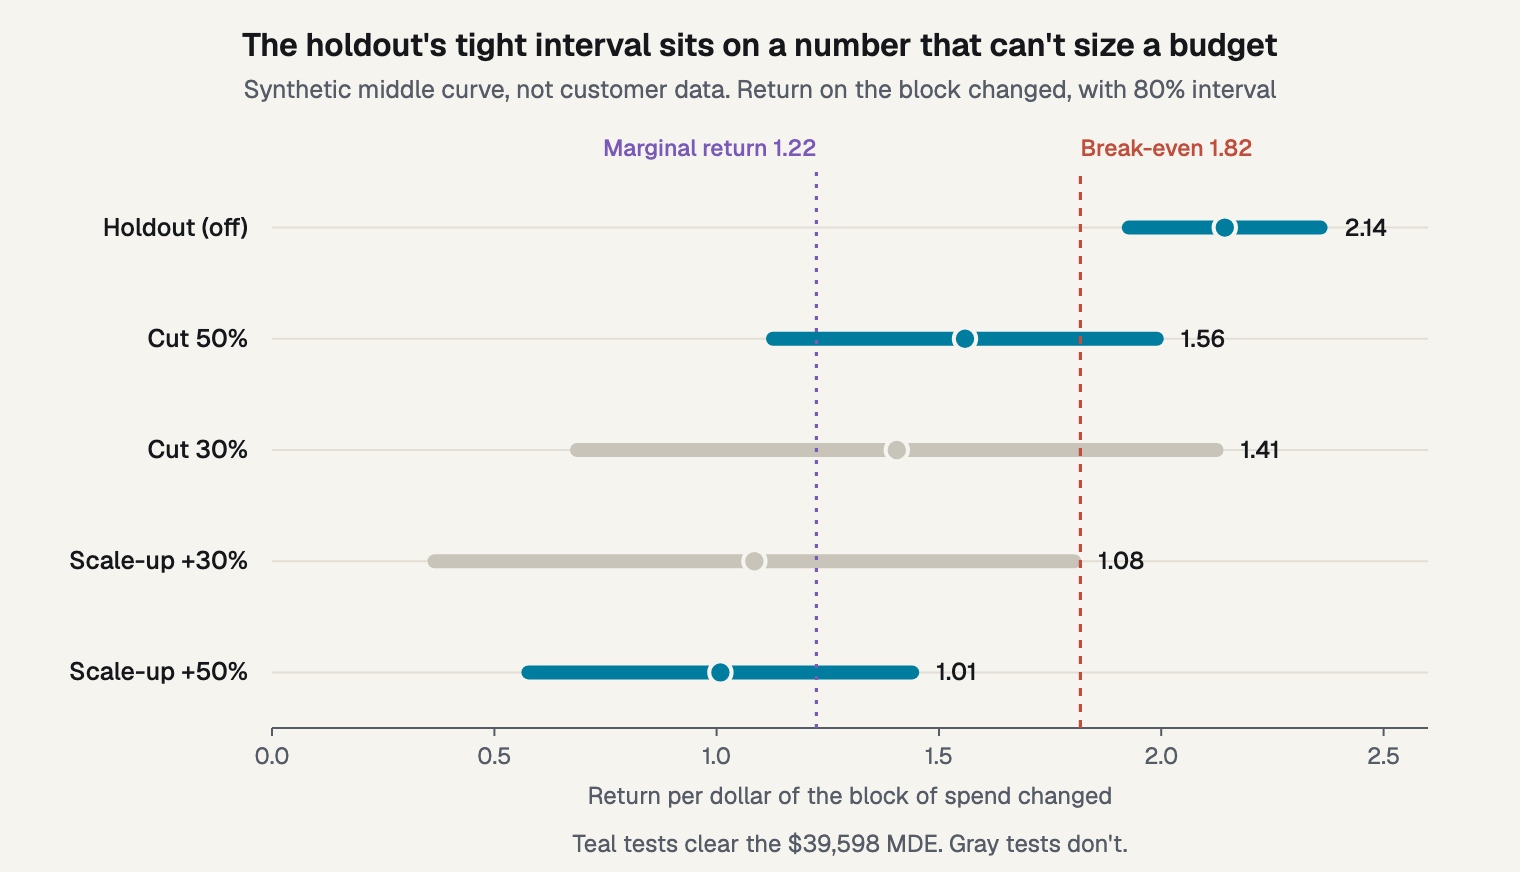
Figure 4. The holdout's interval is the tightest, and it says nothing about adding spend.
A scale-up doesn't have to clear zero to answer the budget question, because the line that matters is break-even. Run the +50% test on all three curves and the point becomes plain.
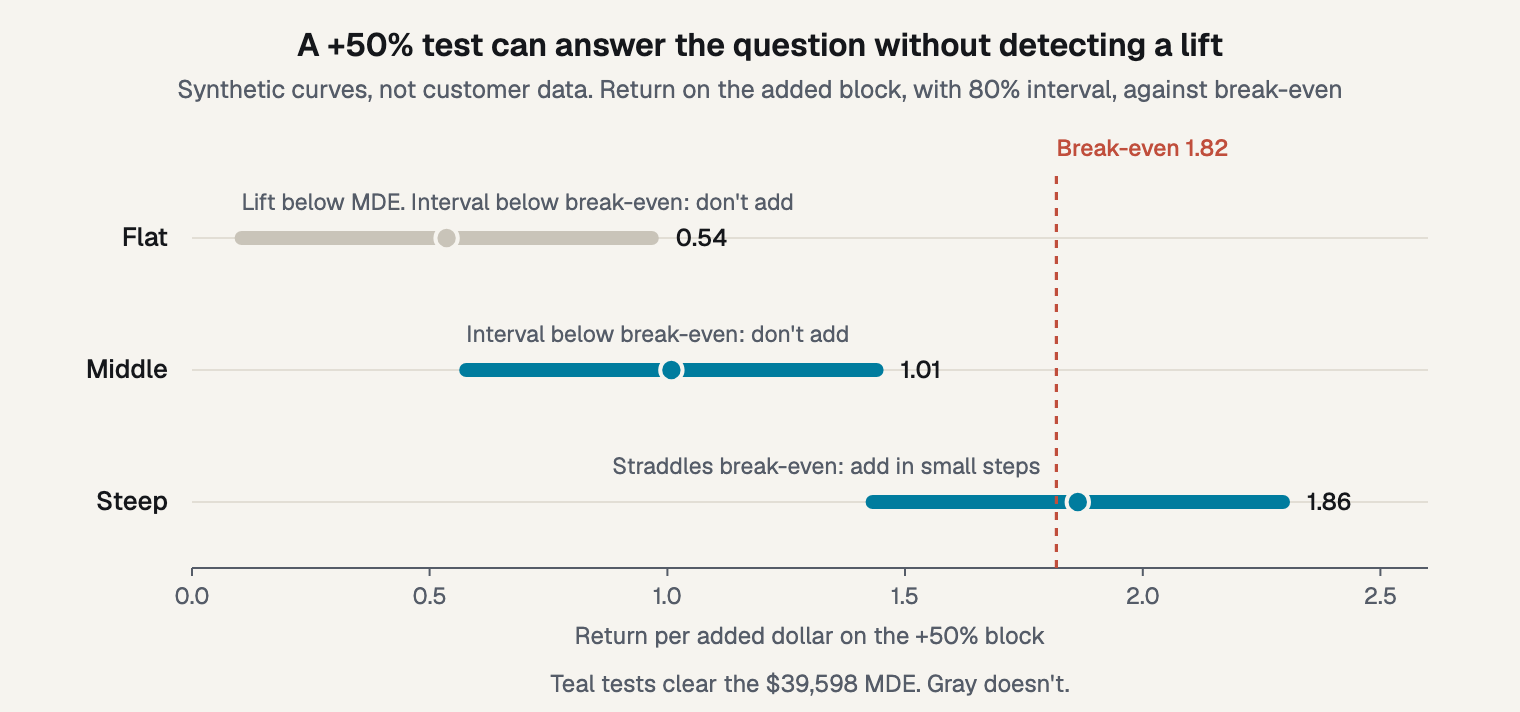
Figure 5. The +50% test against break-even, on all three curves. Synthetic data, not customer data.
On the flat curve, the expected lift of $22,500 sits below the MDE, with just 36% power. Yet the interval of 0.10 to 0.97 is well below 1.82, which answers "should I add?" with a no. The middle curve gives the same answer. The steep curve's 1.43 to 2.30 straddles the line, so add in small steps or run longer.
Timing still applies, since a read taken too early misses part of the effect. If that's your concern, let the carryover finish before you read either test.
Which one fits your budget question?
Choose by the decision you'll make, and write that decision down first. Each question below has one natural test:
- "Is this channel worth having at all?" Holdout.
- "Should more budget go here?" Scale-up.
- "Can spend be trimmed without losing much?" A partial cut.
- "Is this new channel worth starting?" Google's holdback form.
- "A cut isn't possible during peak." A scale-up or a smaller cut.
If you're still deciding where to test, start by picking the channel first. Your team makes the spend changes in the ad platforms, in every design here. I haven't sized regions in this post, so treat the noise figure as an input you'll need to measure.
You can compare spend levels directly, too. Google's page says multi-cell designs need significantly more regions and budget to hold their power. LiftLab, a vendor, describes pacing or saturation tests that vary spend to build a response curve. Either way, the cost rises with every level you add.
Each test also teaches a model something different. A holdout pins the channel's total contribution at today's spend, measured against zero. A scale-up adds a point above today's spend, where the model may have seen nothing. PyMC-Marketing's lift test notebook sets the limit: a test informs marginal return near the spend it covered, without identifying the whole curve.
Frequently asked questions
Can I run both at once?
A multi-cell design can, with a holdout arm and a scale-up arm against one control group. Google's documentation says these designs need significantly more regions and budget to keep their power. If you're short of either, run one test first, starting with the decision you have to make soonest.
Is a partial cut the same as a scale-up?
No. A cut reads the block below today's spend, and a scale-up reads the block above. On the synthetic middle curve, the 50% cut returns 1.56 and the +50% scale-up returns 1.01, with marginal return of 1.22 between them. Use a cut to trim and a scale-up to add.
Does a scale-up work with no regional data?
A national increase can work as a test, but it has no control group, so a forecast has to stand in for one. That's a much weaker read, and a demand shift during the test can look like lift. If you have regional outcomes and regional targeting, use them instead.
How big should a scale-up be?
Size it against your MDE. Google's troubleshooting page mentions +20% to +50% for peak periods, which isn't a general rule. In my synthetic example, +30% has 49% power against the $39,598 bar and +50% has 85%. A bigger change reads more easily, and it averages over more of the curve.
Can a test result go straight into a model?
Yes, if you record the spend level, the spend change and the uncertainty. PyMC-Marketing's lift test rows hold exactly those inputs. Google's Meridian documentation adds that translating an experiment into a prior carries uncertainty beyond its standard error. Treat the result as strong evidence, not a fixed value.
Write the decision down first
Before you pick a test, write one line: what you'll do with each possible result. A keep or cut call points to a holdout, and an add or trim call points to a scale-up or a cut. Then size it, and judge the interval against break-even.
Bayesin's budget view shows where the range widens past the spend you have tried, and that's where the next test belongs. Where the model knows least, Bayesin designs the test. Your team runs it, Bayesin tracks it and reads the result, and the result goes into the next fit.
Sources
- Google for Developers, "Types of experiments," Meridian GeoX documentation
- Google for Developers, "Implementation of geo testing," Meridian GeoX documentation
- Google for Developers, "Troubleshoot design output issues," Meridian GeoX documentation
- Google for Developers, "Calibrate treatment priors," Meridian documentation
- Google for Developers, "ROI, mROI, and Contribution parameterizations," Meridian documentation
- PyMC-Marketing, "Lift Test Calibration," documentation
- Google Research, "Bayesian Methods for Media Mix Modeling with Carryover and Shape Effects," Jin et al., 2017
- Google Research, "Measuring Ad Effectiveness Using Geo Experiments," Vaver and Koehler
- Meta, Robyn, "An Analyst's Guide to MMM," documentation
- LiftLab, "The CMO's Incrementality Testing Playbook," vendor guide, 2026
- Sellforte, "What is incrementality testing? A practical guide," vendor guide, 2026
See it on your own rows.
Bayesin is pre-launch. Join the waitlist and we will reach out as access opens.
Get new posts by email.
New posts only. See privacy for what we keep.